
Before you begin
- Labs create a Google Cloud project and resources for a fixed time
- Labs have a time limit and no pause feature. If you end the lab, you'll have to restart from the beginning.
- On the top left of your screen, click Start lab to begin
Create custom dashboard
/ 25
Create alerting policies
/ 25
Create Resource Group
/ 25
Create uptime check
/ 25

In this lab, you learn how to use Cloud Monitoring to gain insight into applications that run on Google Cloud.
In this lab, you learn how to perform the following tasks:
For each lab, you get a new Google Cloud project and set of resources for a fixed time at no cost.
Click the Start Lab button. If you need to pay for the lab, a pop-up opens for you to select your payment method. On the left is the Lab Details panel with the following:
Click Open Google Cloud console (or right-click and select Open Link in Incognito Window if you are running the Chrome browser).
The lab spins up resources, and then opens another tab that shows the Sign in page.
Tip: Arrange the tabs in separate windows, side-by-side.
If necessary, copy the Username below and paste it into the Sign in dialog.
You can also find the Username in the Lab Details panel.
Click Next.
Copy the Password below and paste it into the Welcome dialog.
You can also find the Password in the Lab Details panel.
Click Next.
Click through the subsequent pages:
After a few moments, the Google Cloud console opens in this tab.

In this task, you verify that three VM instances have been created. You monitor these in the tasks that follow.
In the Google Cloud console, in the Navigation menu (
Verify that the nginxstack-1, nginxstack-2 and nginxstack-3 instances are visible.
In this task, you create a custom dashboard in Cloud Monitoring and examine resource usage data.
), click View all products > Observability > Monitoring.When the Monitoring dashboard opens, your workspace is ready.
In the left pane, click Dashboards.
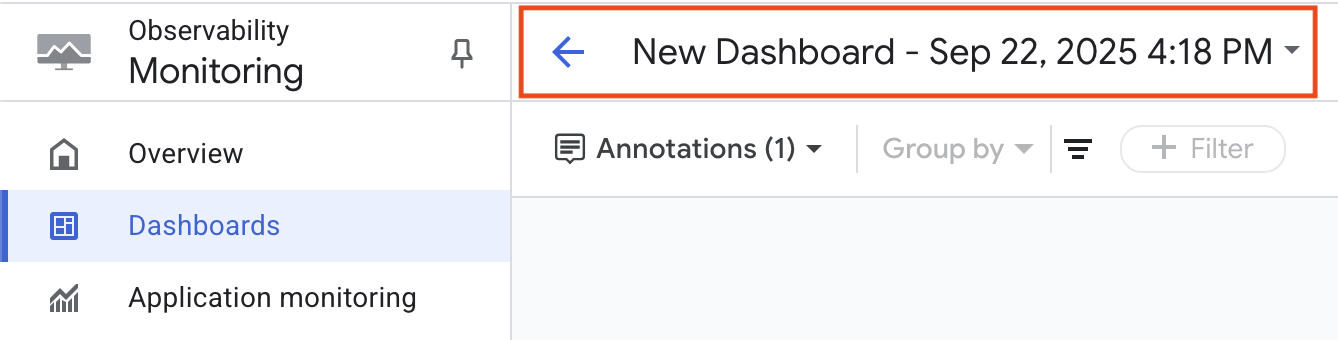
Click Create Custom Dashboard.
In the top pane, click New Dashboard.
Click Add widget, and then select Line.
In Widget title, type My Chart.
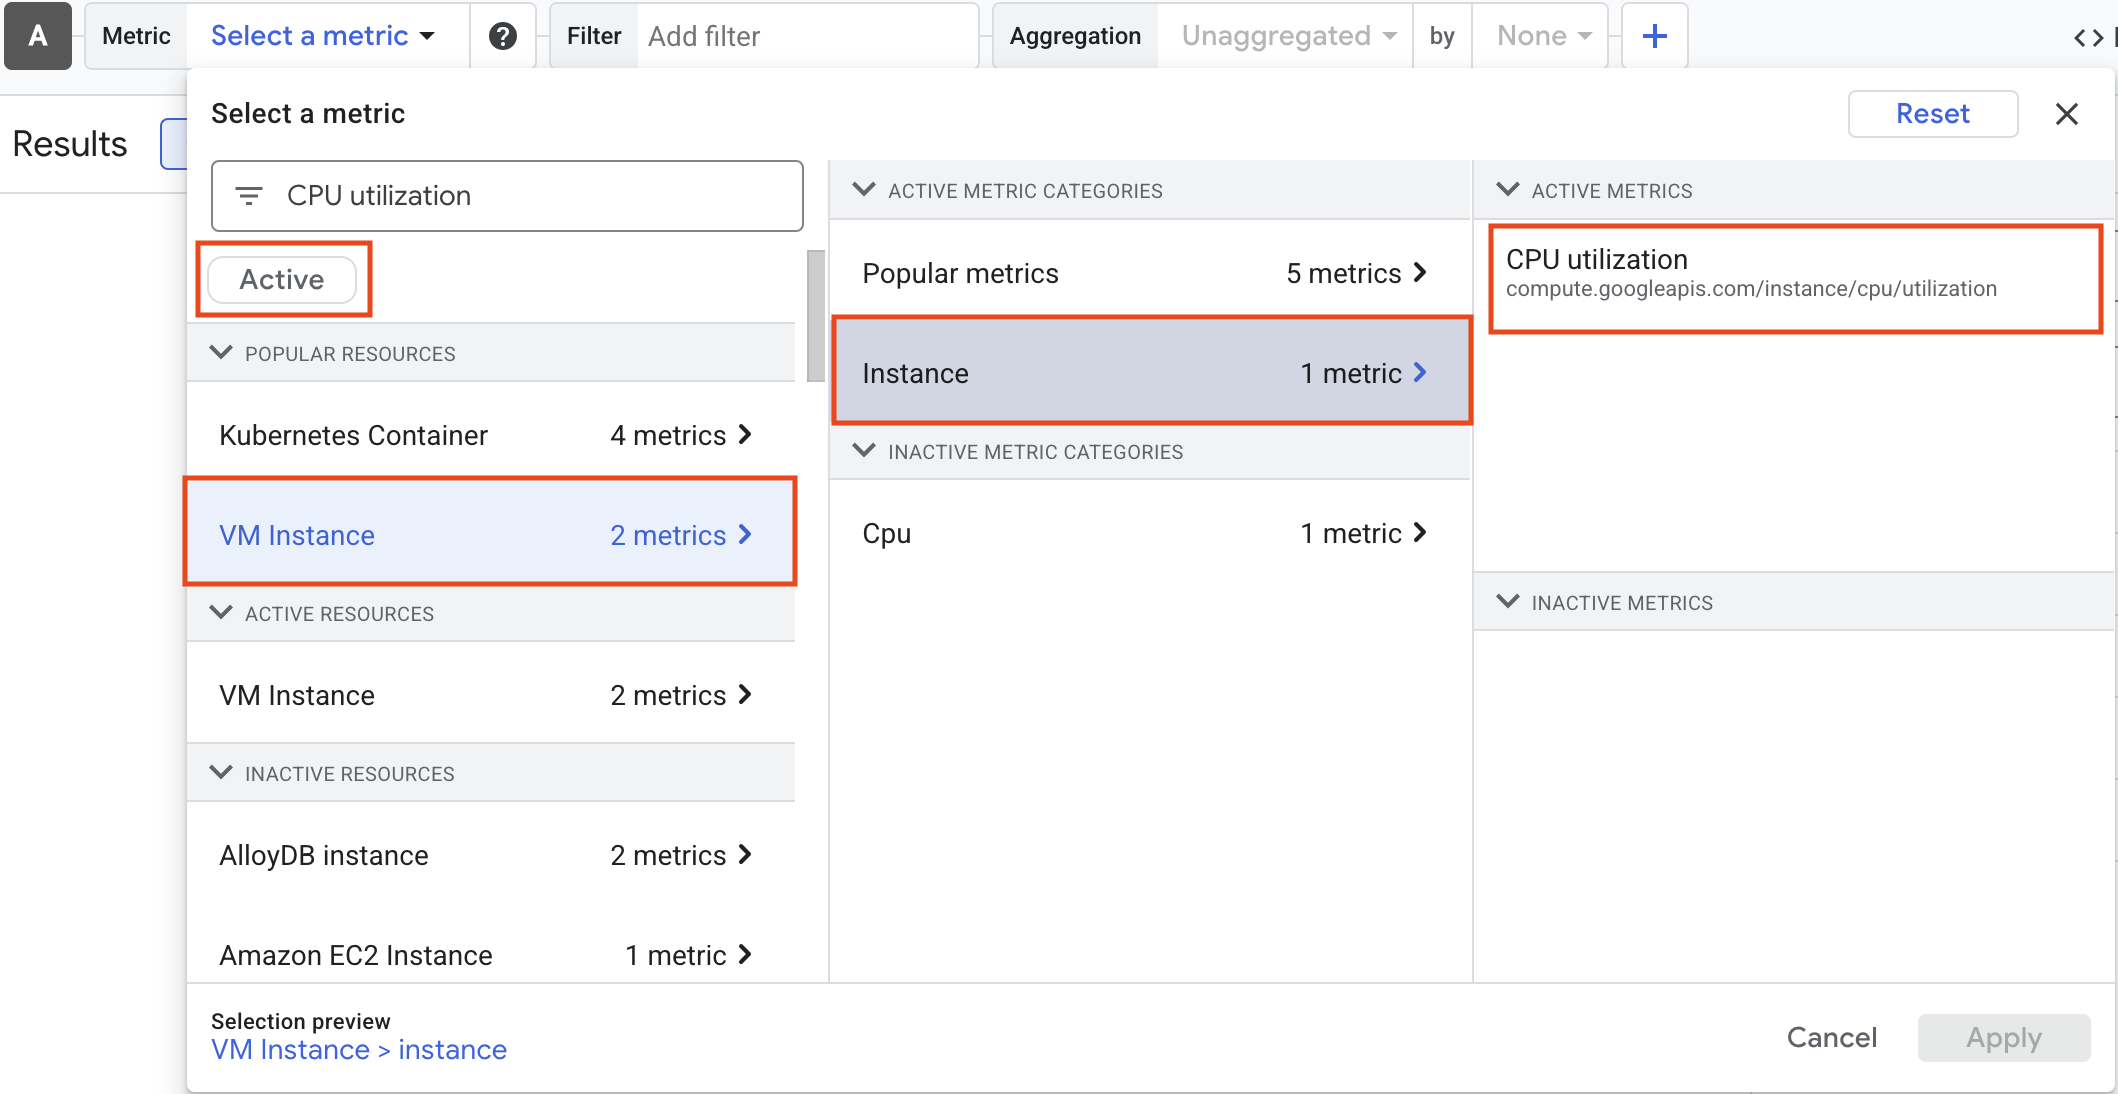
In the Select a metric dropdown, type CPU utilization. Then, click VM Instance > Instance, select CPU utilization, and click Apply.
Active if you are unable to find the CPU utilizationClick + Add Filter and explore the various options.
Click Apply to create the chart.
The Metrics Explorer allows you to examine resources and metrics without having to create a chart on a dashboard. Try to recreate the chart you just created using the Metrics Explorer.
Click Check my progress to verify the objective.
In this task, you create an alert policy in Cloud Monitoring to notify you when CPU usage exceeds a specified threshold.
Click on Notification Channels dropdown list, then click on Manage Notification Channels.
The Notification channels page will open in a new tab.
Scroll down the page and click on Add New for Email.
Enter your personal email in the Email Address field and a Display name.
Click Save.
Go back to the previous Configure notifications and finalize alert tab.
Click on Notification Channels again, then click on the Refresh icon to get the display name you mentioned in the previous step. Click Notification Channels again if needed.
Now, select your Display name and click Ok.
In Alert policy name type My Alert Policy. You may need to scroll down to the bottom of the page to see this.
Click Next.
Review the alert and click Create Policy.
Click Check my progress to verify the objective.
In this task, you create a group in Cloud Monitoring to organize your resources.
Click Check my progress to verify the objective.
In this task, you create an uptime check in Cloud Monitoring to monitor the availability of your resources.
| Property | Value (type value or select option as specified) |
|---|---|
| Protocol | HTTP |
| Resource Type | Instance |
| Applies To | Group |
| Group | VM instances |
| Check Frequency | 1 minute |
Click on Continue to leave the other details to default.
Click Alert & Notification , and then select your notification channel from the Notifications Channel dropdown.
Click Continue.
For Title, type My Uptime check.
Click Test to verify that your uptime check can connect to the resource.
When you see a green check mark everything can connect. Click Create.
The uptime check you configured takes a while for it to become active.
Click Check my progress to verify the objective.
In this task, you disable an existing alert policy in Cloud Monitoring.
Alerting policies stay active for a while after a project is deleted, just in case it needs to be reinstalled. Since this is a lab, and you will not have access to this project again, remove the alerting policy you created.
In the Monitoring tab, click on Alerting.
Click See all policies, on your Policies details page, and then click on the Enabled toggle beside your created alert.
You will be asked to confirm that you want to turn off the alerting policy - click Turn off.
In this lab, you learned how to:
When you have completed your lab, click End Lab. Google Skills removes the resources you’ve used and cleans the account for you.
You will be given an opportunity to rate the lab experience. Select the applicable number of stars, type a comment, and then click Submit.
The number of stars indicates the following:
You can close the dialog box if you don't want to provide feedback.
For feedback, suggestions, or corrections, please use the Support tab.
Copyright 2026 Google LLC All rights reserved. Google and the Google logo are trademarks of Google LLC. All other company and product names may be trademarks of the respective companies with which they are associated.


This content is not currently available
We will notify you via email when it becomes available

Great!
We will contact you via email if it becomes available

One lab at a time
Confirm to end all existing labs and start this one