This lab was developed with our partner, Datadog. Your personal information may be shared with Datadog, the lab sponsor, if you have opted-in to receive product updates, announcements, and offers in your Account Profile.
GSP1167

Overview
Datadog is an observability service for cloud-scale applications, providing monitoring of servers, databases, tools, and services, through a SaaS-based data analytics platform. Google Kubernetes Engine (GKE), a service on the Google Cloud Platform (GCP), is a hosted platform for running and orchestrating containerized applications. Due to Kubernetes’s compartmentalized nature and dynamic scheduling, it can be difficult to diagnose points of failure or track down other issues in your infrastructure. Datadog Agent helps to collect metrics from Docker, Kubernetes, and your containerized applicationss. In this lab you will run the Datadog Agent in a Kubernetes cluster as a DaemonSet in order to start collecting your cluster and applications metrics, traces, and logs. You can deploy a Datadog Agent with a Helm chart or directly with a DaemonSet object YAML definition.
In this lab, you will be explaining and using those options in a real cluster, checking in real time the features they enable.
Objectives
In this lab, you will learn about using the Helm chart used to install the Datadog Agent. You will learn how to:
- Deploy a GKE Standard Cluster.
- Deploy the Datadog Operator and the Datadog Agent.
- Deploy a application.
- Check the default dashboard.
- Check the Logs.
- Create a custom dashboard.
Setup and Requirements
Before you click the Start Lab button
Read these instructions. Labs are timed and you cannot pause them. The timer, which starts when you click Start Lab, shows how long Google Cloud resources are made available to you.
This hands-on lab lets you do the lab activities in a real cloud environment, not in a simulation or demo environment. It does so by giving you new, temporary credentials you use to sign in and access Google Cloud for the duration of the lab.
To complete this lab, you need:
- Access to a standard internet browser (Chrome browser recommended).
Note: Use an Incognito (recommended) or private browser window to run this lab. This prevents conflicts between your personal account and the student account, which may cause extra charges incurred to your personal account.
- Time to complete the lab—remember, once you start, you cannot pause a lab.
Note: Use only the student account for this lab. If you use a different Google Cloud account, you may incur charges to that account.
How to start your lab and sign in to the Google Cloud console
-
Click the Start Lab button. If you need to pay for the lab, a dialog opens for you to select your payment method.
On the left is the Lab Details pane with the following:
- The Open Google Cloud console button
- Time remaining
- The temporary credentials that you must use for this lab
- Other information, if needed, to step through this lab
-
Click Open Google Cloud console (or right-click and select Open Link in Incognito Window if you are running the Chrome browser).
The lab spins up resources, and then opens another tab that shows the Sign in page.
Tip: Arrange the tabs in separate windows, side-by-side.
Note: If you see the Choose an account dialog, click Use Another Account.
-
If necessary, copy the Username below and paste it into the Sign in dialog.
{{{user_0.username | "Username"}}}
You can also find the Username in the Lab Details pane.
-
Click Next.
-
Copy the Password below and paste it into the Welcome dialog.
{{{user_0.password | "Password"}}}
You can also find the Password in the Lab Details pane.
-
Click Next.
Important: You must use the credentials the lab provides you. Do not use your Google Cloud account credentials.
Note: Using your own Google Cloud account for this lab may incur extra charges.
-
Click through the subsequent pages:
- Accept the terms and conditions.
- Do not add recovery options or two-factor authentication (because this is a temporary account).
- Do not sign up for free trials.
After a few moments, the Google Cloud console opens in this tab.
Note: To access Google Cloud products and services, click the Navigation menu or type the service or product name in the Search field.

Activate Cloud Shell
Cloud Shell is a virtual machine that is loaded with development tools. It offers a persistent 5GB home directory and runs on the Google Cloud. Cloud Shell provides command-line access to your Google Cloud resources.
-
Click Activate Cloud Shell  at the top of the Google Cloud console.
-
Click through the following windows:
- Continue through the Cloud Shell information window.
- Authorize Cloud Shell to use your credentials to make Google Cloud API calls.
When you are connected, you are already authenticated, and the project is set to your Project_ID, . The output contains a line that declares the Project_ID for this session:
Your Cloud Platform project in this session is set to {{{project_0.project_id | "PROJECT_ID"}}}
gcloud is the command-line tool for Google Cloud. It comes pre-installed on Cloud Shell and supports tab-completion.
- (Optional) You can list the active account name with this command:
gcloud auth list
- Click Authorize.
Output:
ACTIVE: *
ACCOUNT: {{{user_0.username | "ACCOUNT"}}}
To set the active account, run:
$ gcloud config set account `ACCOUNT`
- (Optional) You can list the project ID with this command:
gcloud config list project
Output:
[core]
project = {{{project_0.project_id | "PROJECT_ID"}}}
Note: For full documentation of gcloud, in Google Cloud, refer to the gcloud CLI overview guide.
Task 1. Deploy a GKE Standard Cluster
In Cloud Shell, run the following commands to create a GKE Standard Kubernetes cluster
gcloud container clusters create "datadog" \
--machine-type="e2-medium" \
--num-nodes="2" \
--zone={{{project_0.default_zone|ZONE}}}
Note: you may get a deprecation warning, you can ignore that.
Click Check my progress to verify the objective.
Deploy a GKE Standard Cluster.
After a few minutes this will spin up a new Kubernetes cluster with the name datadog. In the meantime you can move on with the Datadog account creation step.
Task 2. Set up a Datadog trial account and get your Datadog API key
If you already have a trial account set up, you can use that. It is recommended that you do not use your production Datadog account to avoid cluttering the environment with test and training assets.
-
Navigate to https://us5.datadoghq.com/signup and enter your name, email, company, and a password.
-
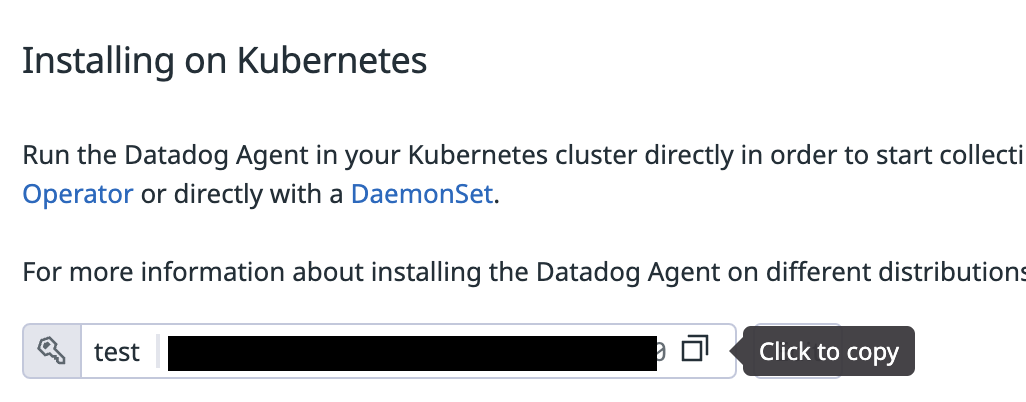
On the next page, you will see a list of available Agent installations. Click Kubernetes.
-
Click Select API Key, then Create New.
-
Enter a name and click Save.
-
Select the row with the new key, and click Use API Key.
-
Copy the Datadog API key.
- In the Cloud Console, navigate to your Cloud Shell window. Type in the following command, replace
<YOUR_DATADOG_API_KEY> with the Datadog API key you copied, and then run the command:
export DD_API_KEY=<YOUR_DATADOG_API_KEY>
Note! If you close the Cloud Shell, you'll lose the environment variable you just added. Keep it somewhere safe temporarily, or just leave the page open with the API key as mentioned above in case you need to add it again.
- In Datadog's console, enable logging by going to
Logs and clicking on Getting Started.
Task 3. Deploy the Datadog Operator and Agent
In this section, you will deploy the Datadog Operator.
- Install the Datadog Operator by running the following command:
helm repo add datadog https://helm.datadoghq.com
helm install datadog-operator datadog/datadog-operator
kubectl create secret generic datadog-secret --from-literal api-key=$DD_API_KEY
- Start by deploying the Datadog Agent by running the following command:
echo "apiVersion: datadoghq.com/v2alpha1
kind: DatadogAgent
metadata:
name: datadog
spec:
global:
clusterName: datadog
registry: gcr.io/datadoghq
site: us5.datadoghq.com
tags:
- env:dev
- gcp:datadog
credentials:
apiSecret:
secretName: datadog-secret
keyName: api-key
features:
logCollection:
enabled: true
containerCollectAll: true" > datadog-agent.yaml
- Deploy the agent to your cluster.
kubectl apply -f datadog-agent.yaml
Note: you may get a deprecation warning, you can ignore that.
Click Check my progress to verify the objective.
Deploy Datadog Operator.
- Run the following to check the secrets that were created:
kubectl get secrets
You should get an output similar to this:
NAME TYPE DATA AGE
datadog-secret Opaque 1 11m
datadog-token Opaque 1 11m
sh.helm.release.v1.datadog-operator.v1 helm.sh/release.v1 1 11m
webhook-certificate Opaque 2 11m
- The most important one is the one called
datadog-secret. This is a secret that was automatically created that contains your API key.
Check that the secret actually contains your API key getting the value and base64 decoding it:
kubectl get secret datadog-secret --template='{{index .data "api-key"}}' | base64 -d
- The other two
token secrets are the ones used by the service accounts to communicate with the API server. Check the workloads that have been deployed:
kubectl get deployments
NAME READY UP-TO-DATE AVAILABLE AGE
datadog-cluster-agent 1/1 1 1 10m
datadog-operator 1/1 1 1 12m
- Run the following command to verify the Datadog Agent is running in your environment as a DaemonSet:
kubectl get daemonset
(Output)
NAME DESIRED CURRENT READY UP-TO-DATE AVAILABLE NODE SELECTOR AGE
datadog-agent 2 2 2 2 2 <NONE> 33m
- Check the status of the Datadog agent:
kubectl exec -ti $(kubectl get pod -l app.kubernetes.io/component=agent -o name) -- agent status
- Check the output and look at the different checks that are running by default.
Task 4. Deploy an Application
- Download the application manifest. This application code lives here
curl https://raw.githubusercontent.com/GoogleCloudPlatform/microservices-demo/main/release/kubernetes-manifests.yaml -o manifest.yaml
- Apply the manifest to your cluster
kubectl apply -f manifest.yaml
Click Check my progress to verify the objective.
Apply the manifest to cluster.
- Watch the status of your deployment
kubectl get po -w
After viewing the status you can exit the command by using CTRL + C.
Task 5. Datadog Kubernetes Explorer
-
Go to the Kubernetes Explorer. Infrastructure > Kubernetes Explorer.
-
You can observe that some of the pods are stuck in pending.
kubectl get po | grep Pending
adservice-694f4ff98-49trp 0/1 Pending 0 4m22s
cartservice-859c54495f-d78p8 0/1 Pending 0 4m24s
loadgenerator-65779994db-mhb24 0/1 Pending 0 4m23s
shippingservice-ff5f4d7d-s974d 0/1 Pending 0 4m23s
The exact pods pending might be differently named, but in any case--you don't enough CPU or Memory to spin up all the pods.
Task 6. Scale the cluster
- GKE has great support for auto scaling node pools based on demand. Set up autoscaling for default-pool.
gcloud container clusters update datadog \
--enable-autoscaling \
--node-pool=default-pool \
--min-nodes=2 \
--max-nodes=5 \
--zone={{{project_0.default_zone|ZONE}}}
- After a few minutes you will see this command succeed. And a few minutes later you will see one or two new nodes show up. You can watch the pods using to check that the pods are now all in running state.
kubectl get po -w
After checking the pod status you can exit the command by using CTRL + C.
- Because all your pods had not started before, the application could not run properly. But now that all your pods are running, you can access the application via the public IP address of the LoadBalancer.
kubectl get svc frontend-external -o json | jq '.status.loadBalancer.ingress[].ip'
- In your browser, you can visit the ip to see the online boutique website.
Click Check my progress to verify the objective.
Scale the size of default node pool.
Task 7. Check Logs in Datadog
-
Go to Logs.
-
Your Apps have been exporting logs that the Datadog agent has been picking up.
-
You can filter these logs based on service, source, and status. You should see quite a few logs since you have loadgenerator service running.
Congratulations
In this lab, you got hands-on experience using the Datadog Helm Chart and installed the Datadog Agent.
Next Steps / Learn More
Be sure to check out the following labs for more practice with Datadog:
Google Cloud training and certification
...helps you make the most of Google Cloud technologies. Our classes include technical skills and best practices to help you get up to speed quickly and continue your learning journey. We offer fundamental to advanced level training, with on-demand, live, and virtual options to suit your busy schedule. Certifications help you validate and prove your skill and expertise in Google Cloud technologies.
Manual Last Updated May 8, 2024
Lab Last Tested May 8, 2024
Copyright 2026 Google LLC All rights reserved. Google and the Google logo are trademarks of Google LLC. All other company and product names may be trademarks of the respective companies with which they are associated.