
Before you begin
- Labs create a Google Cloud project and resources for a fixed time
- Labs have a time limit and no pause feature. If you end the lab, you'll have to restart from the beginning.
- On the top left of your screen, click Start lab to begin
Create a mute rule
/ 25
Create a network
/ 25
Update the firewall rules
/ 50
Create a mute rule
/ 25
Create a network
/ 25
Update the firewall rules
/ 50

Security Command Center (SCC) is a security monitoring platform that helps users accomplish the following:
In this lab, you take your first steps with Security Command Center by exploring the service's interface, configurations, and vulnerability findings.
In this lab, you learn how to perform the following tasks:
It is recommended, but not required, that you are familiar with the following before starting this lab:
Read these instructions. Labs are timed and you cannot pause them. The timer, which starts when you click Start Lab, shows how long Google Cloud resources are made available to you.
This hands-on lab lets you do the lab activities in a real cloud environment, not in a simulation or demo environment. It does so by giving you new, temporary credentials you use to sign in and access Google Cloud for the duration of the lab.
To complete this lab, you need:
Click the Start Lab button. If you need to pay for the lab, a dialog opens for you to select your payment method. On the right is the Lab setup and access panel with the following:
Note that the lab timer is located near the top of the page, showing the remaining time.
Click Open Google Cloud console (or right-click and select Open Link in Incognito Window if you are running the Chrome browser).
The lab spins up resources, and then opens another tab that shows the Sign in page.
Tip: Arrange the tabs in separate windows, side-by-side.
If necessary, copy the Username below and paste it into the Sign in dialog.
You can also find the Username in the Lab setup and access panel.
Click Next.
Copy the Password below and paste it into the Welcome dialog.
You can also find the Password in the Lab setup and access panel.
Click Next.
Click through the subsequent pages:
After a few moments, the Google Cloud console opens in this tab.

Cloud Shell is a virtual machine that is loaded with development tools. It offers a persistent 5GB home directory and runs on the Google Cloud. Cloud Shell provides command-line access to your Google Cloud resources.
Click Activate Cloud Shell 
Click through the following windows:
When you are connected, you are already authenticated, and the project is set to your Project_ID,
gcloud is the command-line tool for Google Cloud. It comes pre-installed on Cloud Shell and supports tab-completion.
Output:
Output:
gcloud, in Google Cloud, refer to the gcloud CLI overview guide.

Cymbal Bank is an American retail bank with over 2,000 branches in all 50 states. It offers comprehensive debit and credit services that are built on top of a robust payments platform. Cymbal Bank is a digitally transforming legacy financial services institution.
Cymbal Bank was founded in 1920 under the name Troxler. Cymbal Group acquired the company in 1975 after it had been investing heavily in Cymbal Group's proprietary ATMs. As the bank grew into a national leader, they put strategic emphasis on modernizing the customer experience both in-person at their branches and digitally through an app they released in 2014. Cymbal Bank employs 42,000 people nationwide and, in 2019, reported $24 billion in revenue.
Cymbal Bank is interested in integrating a centralized security monitoring platform to help monitor threats and remediate vulnerabilities across their Google Cloud resources in their corporate banking applications. As a Cloud Security Engineer, you are tasked with learning about Security Command Center's cutting-edge features so you can deliver a presentation to the CTO on the services' benefits.
In this task, you explore the Security Command Center (SCC) interface to learn about the service's chief features.
 ), select Security > Overview.
Threats and vulnerabilities are two different types of finding classes, which SCC uses to categorize and report security issues in your environment. Refer to the Finding classes documentation to learn more about finding classes.
Threats notify Google Cloud users about current suspicious activities happening in their Google Cloud environments, such as a service account investigating its own permissions.
Vulnerabilities provide information on misconfigurations or vulnerabilities of resources, such as an open TCP port or an outdated library running on a virtual machine.
A finding is a record generated by SCC, which provides details on vulnerability or threat data in the Security Command Center dashboard.
This card enumerates currently active threats that have happened in your project during the period of time determined by the "Time range" dropdown on the right side of this information panel.
By default, the time range dropdown shows all threats that appeared during the last 30 days, but you can view all threats that happened during the last 180 days.
From the Time range selector, select Last 180 days.
Review the Vulnerabilities By resource type tab.
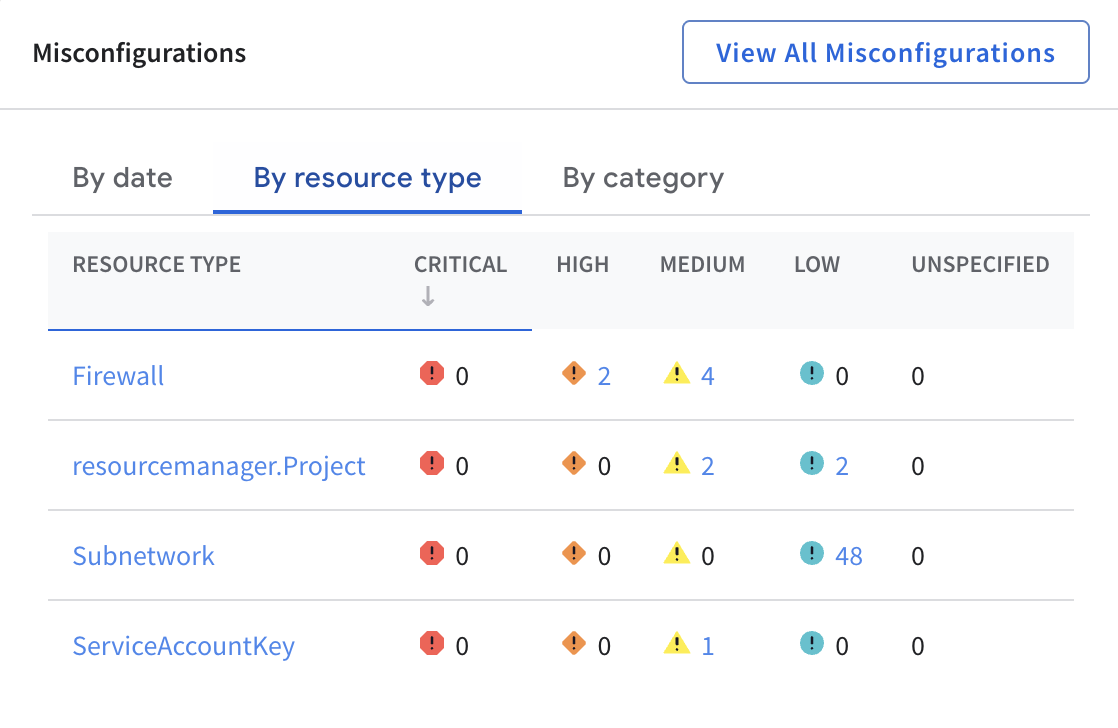
There should be around 60 active vulnerabilities listed.
A majority of these findings are generated because you are using a default VPC network, which is insecure by design, for the purposes of this lab. For example, it contains firewall rules that allow SSH and RDP access from any IP address.
This shows your environment's vulnerabilities organized by different categories of vulnerabilities and their severity. The severity is a property of the finding that helps to estimate the potential risk that an issue poses to the Google Cloud environment.
The level of severity cannot be changed—each type of finding has a severity level that is predetermined by SCC. Below is a list of the different types of severities and common examples:
Detailed criteria for how SCC sets a finding's severity are described on the Finding severities page.
), note the various tabs listed under the Security Command Center header. Here is a description of each.| SCC section | Description |
|---|---|
| Overview | Shows your environment's vulnerabilities organized by different categories of vulnerabilities and severity. |
| Graph Search | Lets you search for assets and findings using natural language queries. |
| Issues | Issues are notable security risks that Security Command Center Premium and Enterprise have identified in your cloud environments. |
| Findings | A finding is a record that Security Command Center services create when they detect a security issue. |
| Assets | Includes asset information from Cloud Asset Inventory, which continuously monitors assets in your cloud environment. |
| Compliance | Shows information about compatibility of your Project with the most important compliance standards such as CIS, PCI DSS, NIST 800-53 and others. |
| Sources | Details the software modules that analyze configuration of Google Cloud resources and monitor current activities by reading log files and checking currently running processes. |
| Posture Management | Lets you use the security posture service in the SCC. Refer to the Manage a security posture guide for more detail. |
In this task, you explore how to configure Security Command Center’s integrated services (sources) at the project level by managing module settings and enabling a specific Security Health Analytics detection module.
Click Settings from the left navigation menu under Security Command Center.
Ensure you are on the Services tab.
This tab allows you to set up parameters of SCC's integrated services, which are also called sources ("the brains of SCC" that you explored in the previous task). For the purposes of this lab, the terms services and sources are interchangeable.
Services detect threats and vulnerabilities and provide information to SCC. Most of them are available only in the Premium edition of SCC, which is provisioned in this lab.
The following are built-in services that you can configure:
Select the Manage settings link for Security Health Analytics.
Choose the Modules tab.
Modules are pre-defined or custom units of detection logic. As you can see, SCC offers many different types of modules that can help you detect different misconfigurations of resources. SCC makes it easy to enable and disable different types of modules to support your security posture and the resources you are interested in monitoring.
In the filter field, type VPC_FLOW_LOGS_SETTINGS_NOT_RECOMMENDED and press Enter.
From the Status section choose the dropdown option by Disabled and select Enable.
With this enabled, Security Health Analytics checks whether the enableFlowLogs property of VPC subnetworks is missing or set to false.
Now that you are familiar with Security Command Center's different services and how to configure them, you can explore how to identify and fix a vulnerability with SCC.
In this task, you analyze and manage vulnerability findings by applying filters, changing finding states, and creating mute rules, then remediate high-severity network risks by updating firewall configurations.
From the Navigation menu (
In the menu on the left, click the Findings tab.
Set the Time range selector in the top-right corner to All time.
By default, the Findings tab displays unmuted findings with a state of ACTIVE.
The two properties, state and mute, of every finding define visibility of findings in many filters used for SCC.
Notice that the query string in the Query preview has changed. (It now has AND category="DEFAULT_NETWORK" attached to it.)
In the Findings query results section, select the checkbox associated with Default network and click Change active state.
Set the state to Inactive for this finding.
Now the finding has been deactivated and hidden from the screen because, by default, only active and unmuted findings are listed.
Click the Edit query button.
Change the query string in the Query editor to category="DEFAULT_NETWORK".
When you're finished editing, click the Apply button.
It may take a minute or two for the change to take effect. Once it does, only one finding for Default network is listed.
In the Findings query results section, select the checkbox for Default network and click Change active state.
Set the state for this finding to Active.
Findings can be activated and deactivated manually, but they can never be deleted by a user. They are deleted automatically only when a finding has not been refreshed by scanners during a period of 13 months.
When a security scanner checks the same finding and does not detect the misconfiguration that kicked off the finding, it marks it as INACTIVE. If the vulnerability still presents in the system, the finding stays in an ACTIVE state.
Click the Clear All button next to Quick Filters to reset the findings tab.
In the Query preview window, click Edit Query.
Now copy and paste the following query:
Now all findings related to subnetworks are displayed. For this lab, the default VPC network is created with the --subnet-mode=auto parameter, so none of its subnets have Private Google Access enabled or write VPC Flow Logs.
When working in a test environment, you sometimes want to hide certain findings. In this instance, you do not want to see SCC findings about Private Google Access in this network, so you want to mute those findings.
In the Quick filters window, select the category Private google access disabled.
In the Finding query results pane, select the uppermost Category checkbox so all "Private google access disabled" findings are selected.
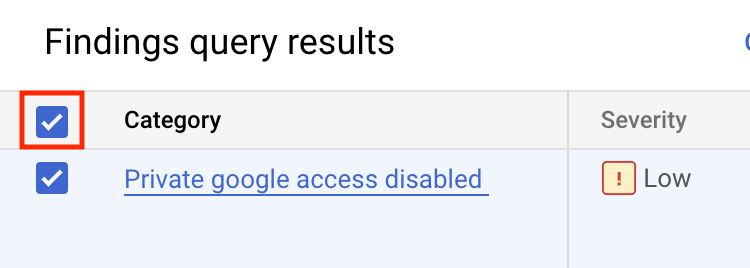
Select Mute options button.
In the dropdown, select Apply mute override. This operation mutes existing findings.
Select Overview in the left-hand menu, and then select Findings to reset the findings view.
Notice that the Private Google access disabled findings are now muted and no longer displayed. Muting is a powerful way to filter SCC results and provides fine-grained control over the resources and findings of interest.
Another misconfiguration of the default network is that VPC Flow Logs are also disabled in the subnets of this network. Since you are working in a test environment, you don't need VPC Flow Logs enabled.
In this section, mute all existing and future findings related to this category.
In the Findings query results window, select Mute options > Manage mute rules.
Click the Create mute rule button.
In the Create dynamic mute rule window, configure the following:
mute-flowlogs-findings
Mute rule for VPC Flow Logs
category="FLOW_LOGS_DISABLED"
Select the Save button.
You'll see a notification that a mute rule was created.
Click Check my progress to verify you've completed this objective.
In this section, you create one more network with automatically configured subnets to test out the recent modifications to your finding rules.
), and run the following command to create the network:Ensure the output you receive is similar to the following.
Output:
Click Check my progress to verify you've completed this objective.
Close the Cloud Shell window after you have verified the above message.
Refresh the SCC findings window to see any new Private google access disabled findings.
You’ll notice that the mute rule you created removed the VPC Flow Log findings.
Although you created mute rules for VPC Flow Logs, SCC still allows you to view them using the query editor.
Click the Edit Query button, and paste in the following to overwrite the existing query filter text:
Click Apply.
In the Findings query results window, both the "default" and "SCC-lab-net" networks are listed in the Resource display name column.
Rows per page is set to 100. Also check that the Time Range parameter is set to the All time value.
In the Query preview window, click Edit Query.
Copy and paste this query to overwrite the existing query text:
When you're finished editing, click the Apply button.
This shows you the findings you had muted previously.
In this section, you investigate and explore how to fix two findings with high severity.
You’ll see two findings: Open RDP port and Open SSH port. They were initiated because the "default" network contains two firewall rules, which enable SSH and RDP internet traffic for all instances in this network.
A new window appears, which provides a detailed description of the issue itself, a list of affected resources, and "Next steps" to help you remediate it.
In the Next steps section, click the link to go to the firewall rules page, which opens in a new tab.
Click Edit.
Delete the source IP range, 0.0.0.0/0.
Add the following source IP range 35.235.240.0/20 and press Enter.
Do not change any other parameters!
Click Save.
Once saved, close the browser tab where you edited the firewall rule.
Refresh the SCC findings browser tab.
You should now see only one finding with High severity—Open SSH Port.
Click on the Open SSH port finding.
Scroll down to the Next steps section, and click the link to go to the firewall rules page, which opens in a new tab.
Click Edit.
Delete the source IP range, 0.0.0.0/0.
Add the following source IP range 35.235.240.0/20 and press Enter.
Do not change any other parameters!
Click Save.
Once saved, close the browser tab where you edited the firewall rule.
Click Check my progress to verify you've completed this objective.
Close the window with the open findings description and refresh the browser window.
You should see no findings with High severity.
Throughout this lab, you learned how to explore the Security Command Center interface elements, configure SCC settings at the project level, and analyze and fix SCC vulnerability. You have also used SCC to identify and remediate critical security vulnerabilities in your Google Cloud environment.
...helps you make the most of Google Cloud technologies. Our classes include technical skills and best practices to help you get up to speed quickly and continue your learning journey. We offer fundamental to advanced level training, with on-demand, live, and virtual options to suit your busy schedule. Certifications help you validate and prove your skill and expertise in Google Cloud technologies.
Manual Last Updated on February 23, 2026
Lab last tested on February 23, 2026
Copyright 2026 Google LLC. All rights reserved. Google and the Google logo are trademarks of Google LLC. All other company and product names may be trademarks of the respective companies with which they are associated.


This content is not currently available
We will notify you via email when it becomes available

Great!
We will contact you via email if it becomes available

One lab at a time
Confirm to end all existing labs and start this one
Complete this quick step to start your lab.