
Before you begin
- Labs create a Google Cloud project and resources for a fixed time
- Labs have a time limit and no pause feature. If you end the lab, you'll have to restart from the beginning.
- On the top left of your screen, click Start lab to begin

In this lab, you use AutoML to train and test a forecasting model, and then make predictions. With the sales dataset from a retail store, you walk through an end-to-end workflow from importing data, to training the model and evaluating the performance, and finally running a batch inference.
You learn how to:
This Google Skills hands-on lab lets you do the lab activities yourself in a real cloud environment, not in a simulation or demo environment. It does so by giving you new, temporary credentials that you use to sign in and access Google Cloud for the duration of the lab.
To complete this lab, you need:
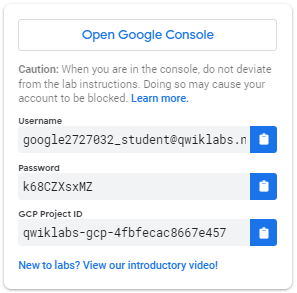
Click the Start Lab button. If you need to pay for the lab, a pop-up opens for you to select your payment method. On the left is a panel populated with the temporary credentials that you must use for this lab.
Copy the username, and then click Open Google Console. The lab spins up resources, and then opens another tab that shows the Choose an account page.
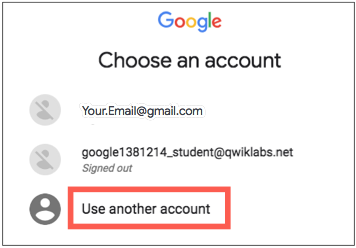
On the Choose an account page, click Use Another Account. The Sign in page opens.
Paste the username that you copied from the Connection Details panel. Then copy and paste the password.
After a few moments, the Cloud console opens in this tab.
In this task, you prepare the training dataset by importing it from a BigQuery table.
This lab uses the sales data from a retail store. The main purpose of the lab is to walk you through an end-to-end workflow to build a forecasting solution rather than creating a comprehensive model. Therefore, the dataset used in this lab is simple and straightforward. It has 8280 data points and includes three columns. It relies on the historical sales only to predict the future sales, which is called a univariate time series.
RetailSales.There are three options to import data in Vertex AI:
In this lab, you import the dataset from BigQuery.
For the Select a data source, select Select a table or view from BigQuery.
Enter the following BigQuery path:
To see the descriptive statistics of your dataset, click the tab Analyze and then the button Generate statistics .
When the statistics are ready, click each column name to display analytical charts.
With the dataset ready, you build the forecasting model and train it.
Click Train new model. You go through 4 steps of configuration:
For Model training method, select AutoML.
Click Continue.
Specify the model name and columns. You start from Train new model.
Specify the model name, such as RetailSales.
For Target column, select Sales (FLOAT).
For Series identifier column, select Department_id (STRING).
For Timestamp column, select Date (DATE).
Define forecasting configuration.
For Data granularity, select Daily.
Holiday regions is optional based on your own region, for example, you can select NA (North America).
For Forecast horizon, enter 5, meaning you want to forecast the future 5 days of sales.
For Context window, enter 5, meaning you want to use the 5 days of the historical data to predict the future sales.
(Optional) Explore advanced options. You are suggested to keep the default options for the lab purpose.
For Data split, you have the option to choose either Chronological which is the default automatic data split or manual.
For Window selection options, you can choose from count, stride, and column to determine how you want to generate sliding windows (context window plus forecast horizon).
For Encryption, you can choose from Google-managed encryption key and Customer-managed encryption key (CMEK).
Click Continue.
Specify the role of each column.
(Optional) Explore Advanced options.
For Weight column, you can decide if you want certain columns to weight differently in prediction.
For Optimization objectives, you can select different optimization objectives other than the default RMSE.
For more information about optimization objectives for tabular AutoML models, refer to the Optimization objectives for tabular AutoML models guide.
You can also set Hierarchical forecasting.
Click Continue.
For Budget, which represents the number of node hours for training, enter 1.
Training your AutoML model for 1 compute hour is typically a good start for understanding whether there is a relationship between the features and label you've selected. From there, you can modify your features and train for more time to improve model performance.
Click Start training.
The training takes about 2 hours. AutoML uses the technology called Neural Architecture Search (NAS) to automatically search through multiple ML models, and provide you the best result by averaging the top ten models in terms of performance. Depending on the data size and the training method, the training can take a couple of hours. In production you receive an email from Google Cloud when training completes. However, that's not the case in the lab environment. So now it's time for you to chill out and click back (click training from the left menu, where you can find the status of your model training) after about 2 hours.
Once the model training completes, it's time to evaluate the performance.
Select Training from the left menu, click the model name (for example, RetailSales).
The first tab is evaluate, you can find the metrics such as MAE, MAPE, RMSE, RMSLE, and R square.
Among the different metrics, RMSE is the one you normally use. The number is high, 12,597,752 (yours can be slightly different). To convert it to a standardized RMSE is about 90%. The higher the value of RMSE the lower the performance.
Let's look at R square, it's 0.007 (yours can be slightly different). The lower the value of R square the lower the performance.
In sum, the metrics indicate a low performance of this model. Among many reasons, the lack of features in the forecasting model is one important cause. Due to the restriction of the maximum lab time (the model training time), you depend the forecasting completely on the historical sales data. You can, in the future, include more features such as advertisement and promotion in the forecasting model to achieve better performance.
Though you can't gain many insights from this case, the analysis based on feature importance helps build a better model. You might decide to remove the least important features next time or to combine two of the more significant features into a feature cross to see whether this improves model performance.
Feature importance is one example of Vertex AI’s comprehensive machine learning functionality called Explainable AI. Explainable AI is a set of tools and frameworks to help understand and interpret predictions made by machine learning models.
In this task, you use a batch inference to forecast the future sales from the model you just trained.
Click Batch inference, from the left menu, and select the Region
Click + Create and specify the name of the batch inference, for example, ForecastSales.
Select the Version 1 for Version.
For Select source, choose BigQuery table, and for BigQuery Path enter:
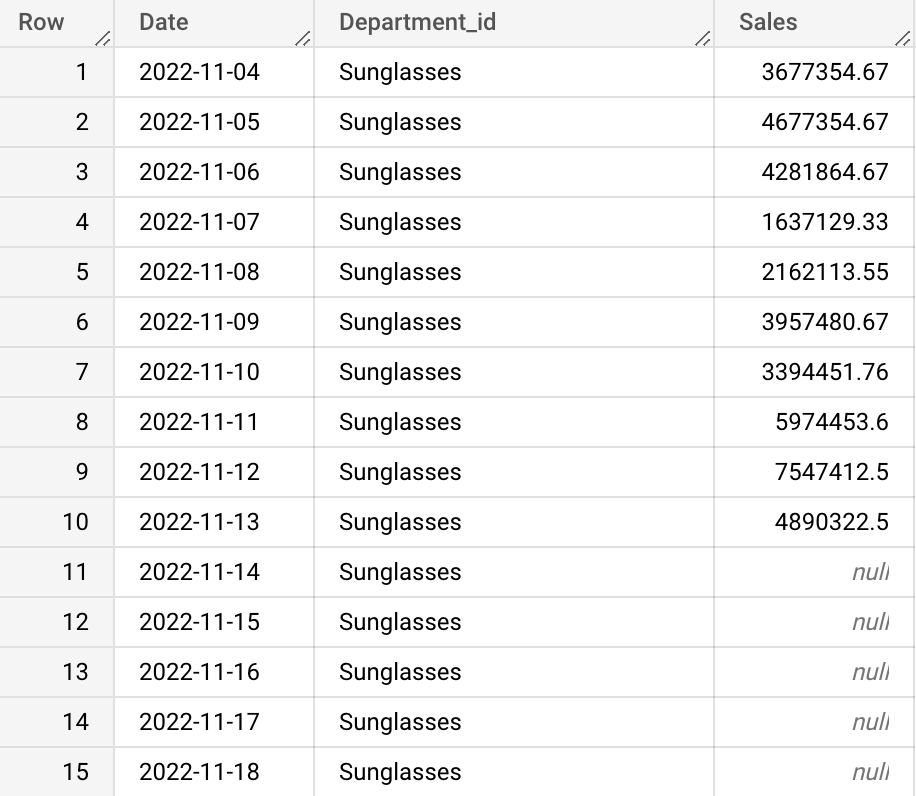
The input data looks like below, where you have the same format as the training data but with five rows (the forecast window) with null values for sales that you want to predict.
Depending on the resources (budget and pricing), it takes about a few minutes to finish the forecasting. If you have 1 budget hour as in this lab, it takes about 30 minutes.
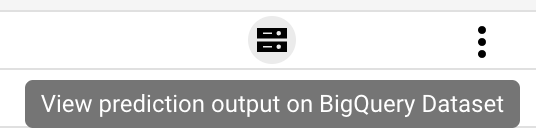
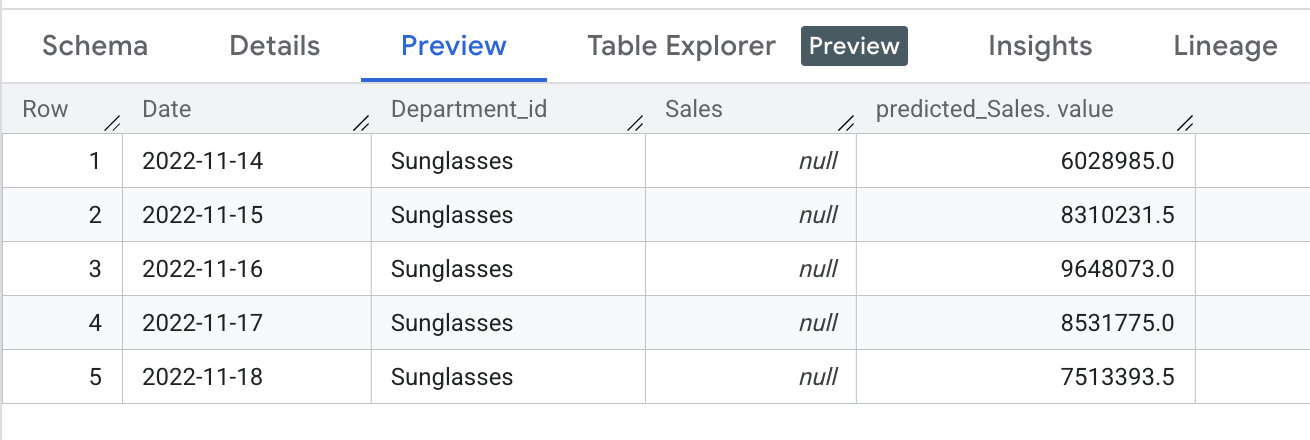
The output of the forecasting looks like below, where you find an additional column named predicted_sales. The column includes the five values you want to predict at the forecasting time.
You have successfully built and trained a forecasting model with AutoML and run a batch inference based on the trained model! In this lab, you learned about importing data, building a forecast model, evaluating the model performance, and forecasting sales using a batch inference in Vertex AI.
Hope you enjoyed it! Now you're ready to build your own forecasting solution!
When you have completed your lab, click End Lab. Google Skills removes the resources you’ve used and cleans the account for you.
You will be given an opportunity to rate the lab experience. Select the applicable number of stars, type a comment, and then click Submit.
The number of stars indicates the following:
You can close the dialog box if you don't want to provide feedback.
For feedback, suggestions, or corrections, please use the Support tab.
Copyright 2026 Google LLC All rights reserved. Google and the Google logo are trademarks of Google LLC. All other company and product names may be trademarks of the respective companies with which they are associated.


This content is not currently available
We will notify you via email when it becomes available

Great!
We will contact you via email if it becomes available

One lab at a time
Confirm to end all existing labs and start this one