GSP1027

總覽
Google Cloud Managed Service for Prometheus 的收費依據為擷取至 Cloud Monitoring 的樣本數量,以及對 Monitoring API 發出的讀取要求。因此,擷取的樣本數是影響費用的主要因素。
在本實驗室中,您將瞭解使用 Google Cloud Managed Service for Prometheus 時,如何運用成本控管機制。
目標
本實驗室的學習內容包括:
- 在 Google Kubernetes Engine (GKE) 叢集部署 Google Managed Prometheus (GMP) 和 Python 應用程式
- 篩選產生的指標資料,減少傳送至代管服務的時間序列指標數量
- 變更抓取間隔,減少收集的樣本數
設定和需求
瞭解以下事項後,再點選「Start Lab」按鈕
請詳閱以下操作說明。實驗室活動會計時,且中途無法暫停。點選「Start Lab」後就會開始計時,顯示可使用 Google Cloud 資源的時間。
您將在真正的雲端環境完成實作實驗室活動,而不是模擬或示範環境。為此,我們會提供新的暫時憑證,供您在實驗室活動期間登入及存取 Google Cloud。
為了順利完成這個實驗室,請先確認:
- 可以使用標準的網際網路瀏覽器 (Chrome 瀏覽器為佳)。
注意事項:請使用無痕模式 (建議選項) 或私密瀏覽視窗執行此實驗室,這可以防止個人帳戶和學員帳戶之間的衝突,避免個人帳戶產生額外費用。
- 是時候完成實驗室活動了!別忘了,活動一旦開始將無法暫停。
注意事項:務必使用實驗室專用的學員帳戶。如果使用其他 Google Cloud 帳戶,可能會產生額外費用。
如何開始實驗室及登入 Google Cloud 控制台
-
按一下「Start Lab」按鈕。如果實驗室會產生費用,請在開啟的對話方塊中選取付款方式。右側的「Lab setup and access」面板會顯示下列項目:
- 「Open Google Cloud console」按鈕
- 此實驗室所需的臨時憑證 (使用者名稱和密碼)
- 完成此實驗室所需的其他資訊 (如有)
請注意,實驗室計時器位於頁面頂端附近,會顯示剩餘時間。
-
按一下「Open Google Cloud console」。如果使用 Chrome 瀏覽器,也可以按一下滑鼠右鍵,選取「在無痕視窗中開啟連結」。
接著,實驗室會啟動相關資源,並開啟另一個分頁,顯示「登入」頁面。
提示:您可以在不同的視窗並排開啟分頁。
注意:頁面顯示「選擇帳戶」對話方塊時,請點選「使用其他帳戶」。
-
如有必要,請將下方的 Username 貼到「登入」對話方塊。
{{{user_0.username | "Username"}}}
您也可以在「Lab setup and access」面板找到「Username」。
-
點選「下一步」。
-
複製下方的 Password,並貼到「歡迎使用」對話方塊。
{{{user_0.password | "Password"}}}
您也可以在「Lab setup and access」面板找到「Password」。
-
點選「下一步」。
重要事項:請務必使用實驗室提供的憑證,而非自己的 Google Cloud 帳戶憑證。
注意:如果使用自己的 Google Cloud 帳戶來進行這個實驗室,可能會產生額外費用。
-
繼續點按後續頁面:
- 接受條款及細則。
- 由於這是臨時帳戶,請勿新增救援選項或雙重驗證機制。
- 請勿申請免費試用。
Google Cloud 控制台稍後會在這個分頁開啟。
注意:如要使用 Google Cloud 產品和服務,請按一下「導覽選單」,或在「搜尋」欄位輸入服務或產品名稱。
啟動 Cloud Shell
Cloud Shell 是搭載多項開發工具的虛擬機器,提供永久的 5 GB 主目錄,而且在 Google Cloud 中運作。Cloud Shell 提供指令列存取權,方便您使用 Google Cloud 資源。
-
點按 Google Cloud 控制台頂端的「啟用 Cloud Shell」圖示  。
。
-
系統顯示視窗時,請按照下列步驟操作:
- 繼續操作 Cloud Shell 視窗。
- 授權 Cloud Shell 使用您的憑證發出 Google Cloud API 呼叫。
連線建立完成即代表已通過驗證,而且專案已設為您的 Project_ID:。輸出內容中有一行文字,宣告本工作階段的 Project_ID:
Your Cloud Platform project in this session is set to {{{project_0.project_id | "PROJECT_ID"}}}
gcloud 是 Google Cloud 的指令列工具,已預先安裝於 Cloud Shell,並支援 Tab 鍵自動完成功能。
- (選用) 您可以執行下列指令來列出使用中的帳戶:
gcloud auth list
- 點按「授權」。
輸出內容:
ACTIVE: *
ACCOUNT: {{{user_0.username | "ACCOUNT"}}}
To set the active account, run:
$ gcloud config set account `ACCOUNT`
- (選用) 您可以使用下列指令來列出專案 ID:
gcloud config list project
輸出內容:
[core]
project = {{{project_0.project_id | "PROJECT_ID"}}}
注意:如需 gcloud 的完整說明,請前往 Google Cloud 參閱 gcloud CLI 總覽指南。
工作 1:部署 GKE 叢集
gcloud beta container clusters create gmp-cluster --num-nodes=1 --zone {{{project_0.default_zone|ZONE}}} --enable-managed-prometheus
gcloud container clusters get-credentials gmp-cluster --zone={{{project_0.default_zone|ZONE}}}
工作 2:部署代管集合
設定 PodMonitoring 資源
下列資訊清單可為 gmp-test 命名空間定義 PodMonitoring 資源 prom-example。這項資源會使用 Kubernetes 標籤選取器,找出命名空間中含有 app 標籤且值為 prom-example 的 Pod。系統每 30 秒會透過 /metrics HTTP 路徑的 metrics 通訊埠,抓取相符 Pod 的資料。
apiVersion: monitoring.googleapis.com/v1
kind: PodMonitoring
metadata:
namespace: gmp-system
name: collector
labels:
app.kubernetes.io/name: collector
app.kubernetes.io/part-of: google-cloud-managed-prometheus
spec:
selector:
matchLabels:
app.kubernetes.io/name: collector
endpoints:
- port: prom-metrics
interval: 10s
- port: cfg-rel-metrics
interval: 10s
kubectl -n gmp-system apply -f https://raw.githubusercontent.com/GoogleCloudPlatform/prometheus-engine/main/examples/self-pod-monitoring.yaml
代管收集器已開始抓取相符的 Pod。
部署範例應用程式
代管服務提供範例應用程式的資訊清單,該應用程式會在指標通訊埠發布 Prometheus 指標。這個應用程式使用三個副本。
kubectl -n gmp-system apply -f https://raw.githubusercontent.com/GoogleCloudPlatform/prometheus-engine/main/examples/example-app.yaml
確認是否已部署 Prometheus
工作 3:Cloud Monitoring
如要以 Cloud Monitoring 時間序列的形式查看 Managed Service for Prometheus 資料,請使用 Metrics Explorer。如要設定 Metrics Explorer 來顯示指標,請執行下列操作:
- 前往 Cloud 控制台的「Monitoring」。
- 在 Monitoring 導覽窗格中,點按「
 Metrics Explorer」。
- 指定要在圖表中顯示的資料。您可以使用 MQL 編輯器完成這項操作。
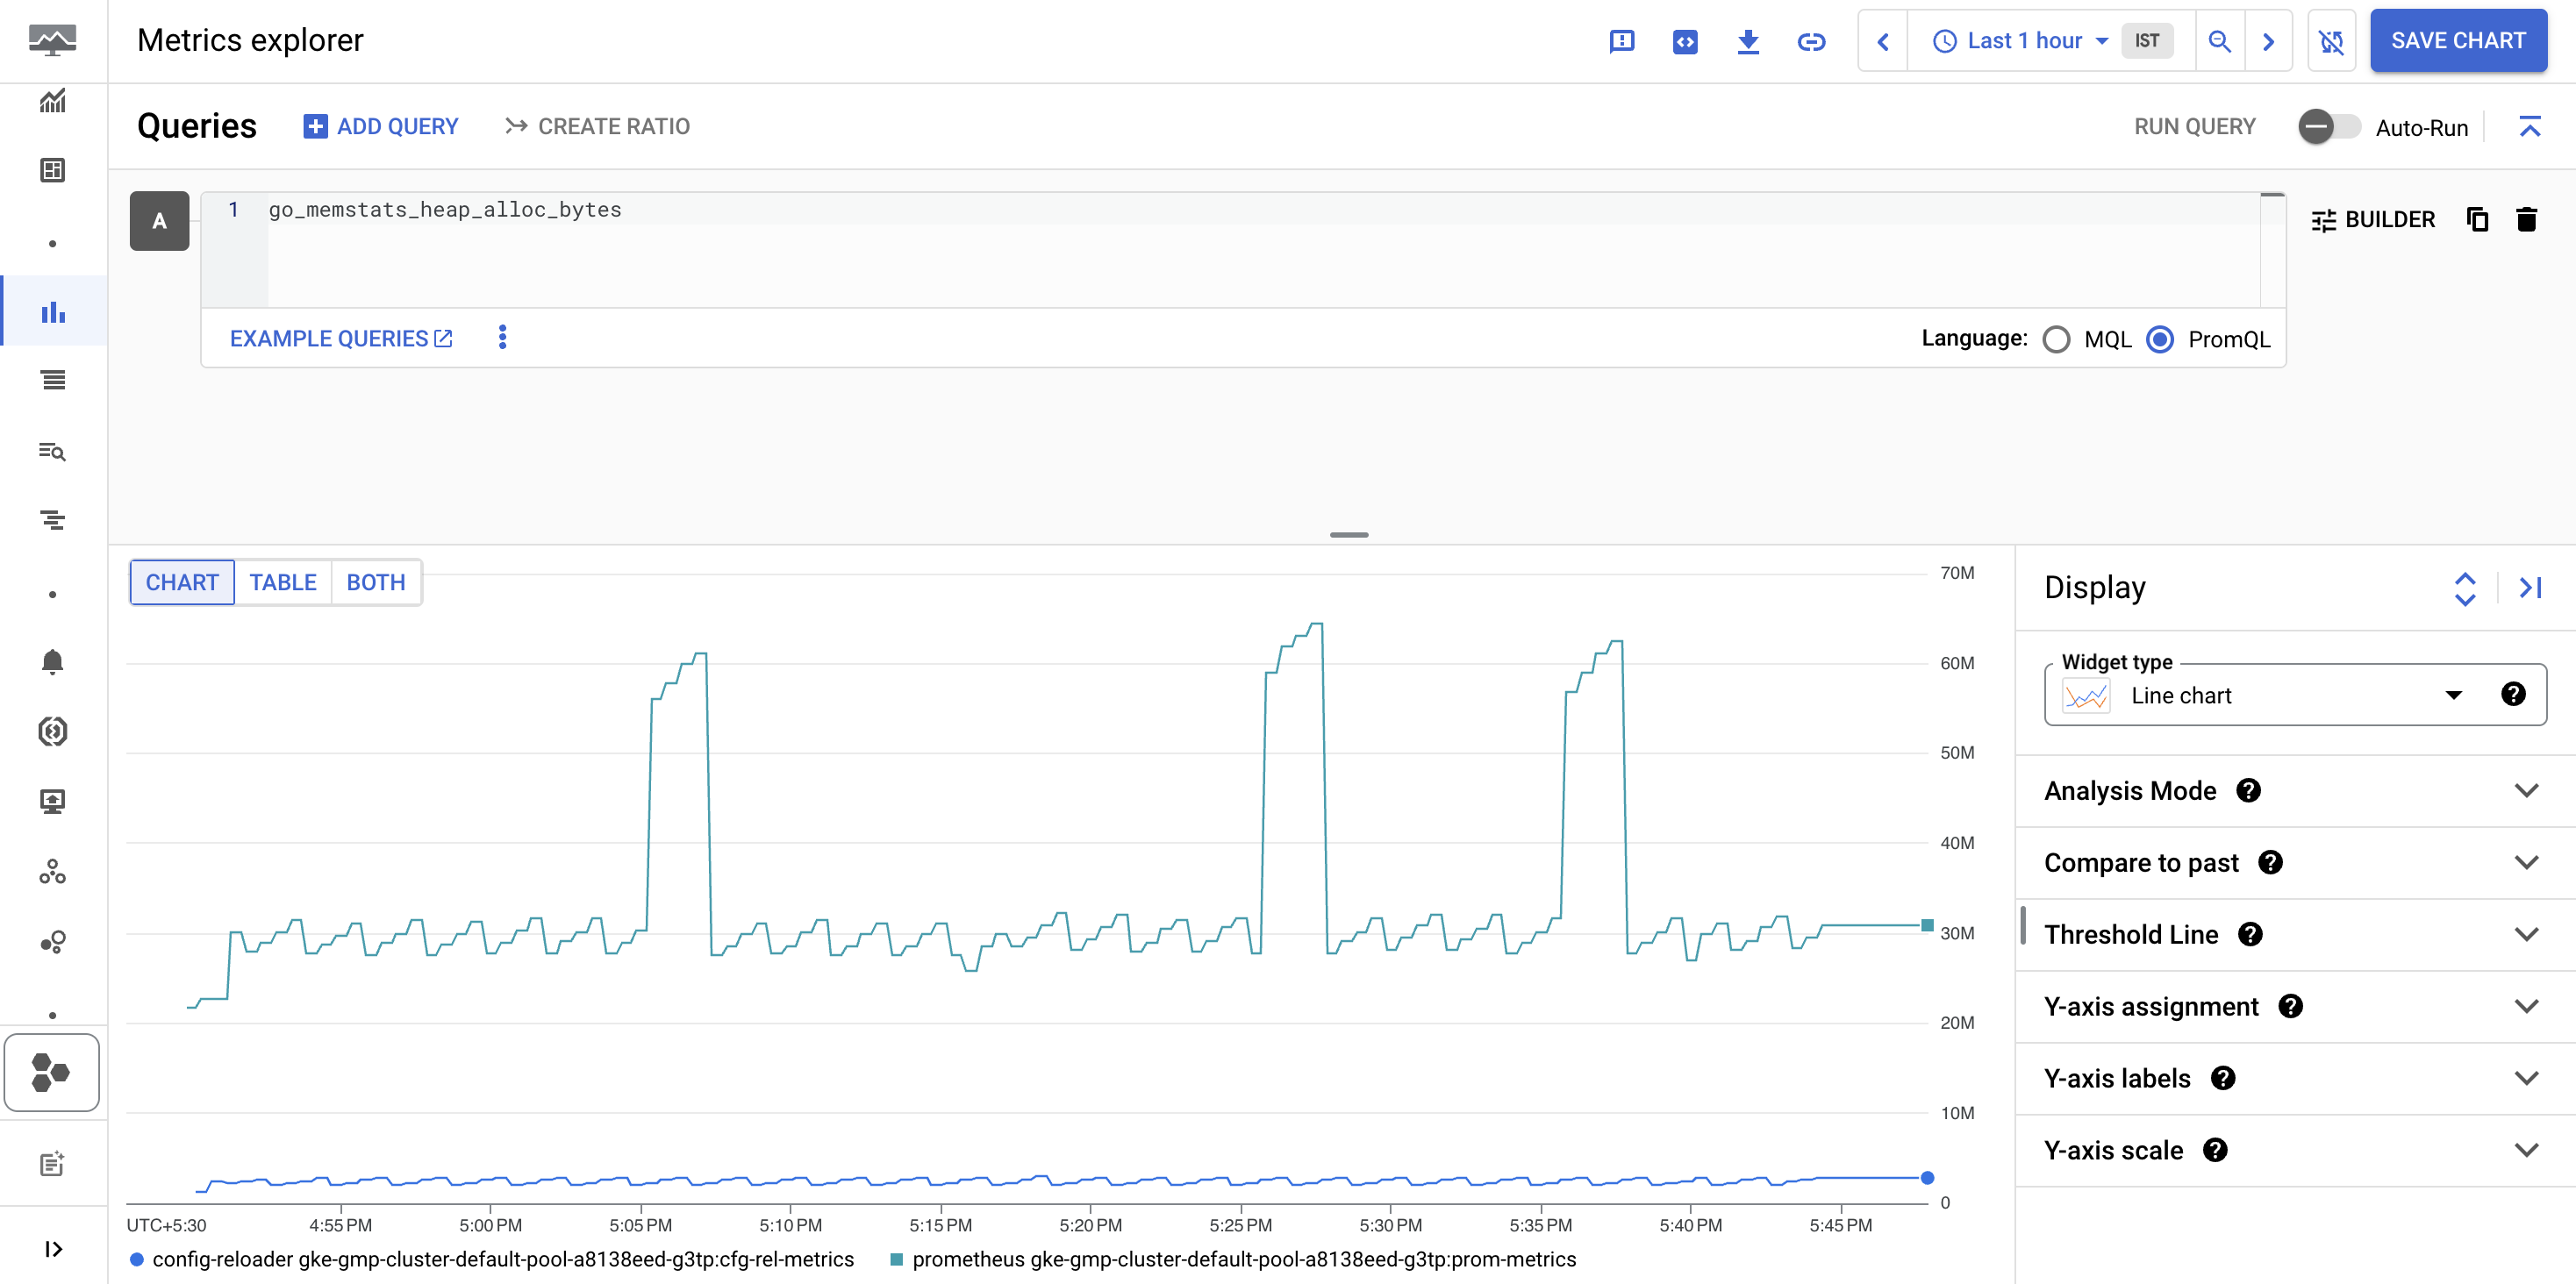
工作 4:填入圖表
go_memstats_heap_alloc_bytes
選取後,系統會顯示類似如下的圖表。
工作 5:篩選匯出的指標
如果收集的資料量很多,您可能需要避免部分時間序列傳送至 Managed Service for Prometheus,藉此降低成本。
如要篩選匯出的指標,可以在 OperatorConfig 資源中設定一組 PromQL 系列選取器。如果時間序列符合至少一個選取器,就會匯出至 Managed Service for Prometheus。
- 開啟
OperatorConfig 資源進行編輯:
kubectl -n gmp-public edit operatorconfig config
- 在 apiVersion 行後按下 i 鍵,進入插入模式。拉到最後一行,然後按下 Enter 鍵,即可前往新的一行。請確認行首沒有縮排,然後貼上下列內容:
collection:
filter:
matchOneOf:
- '{job="prom-example"}'
- '{__name__=~"job:.+"}'
檔案內容應如下所示:
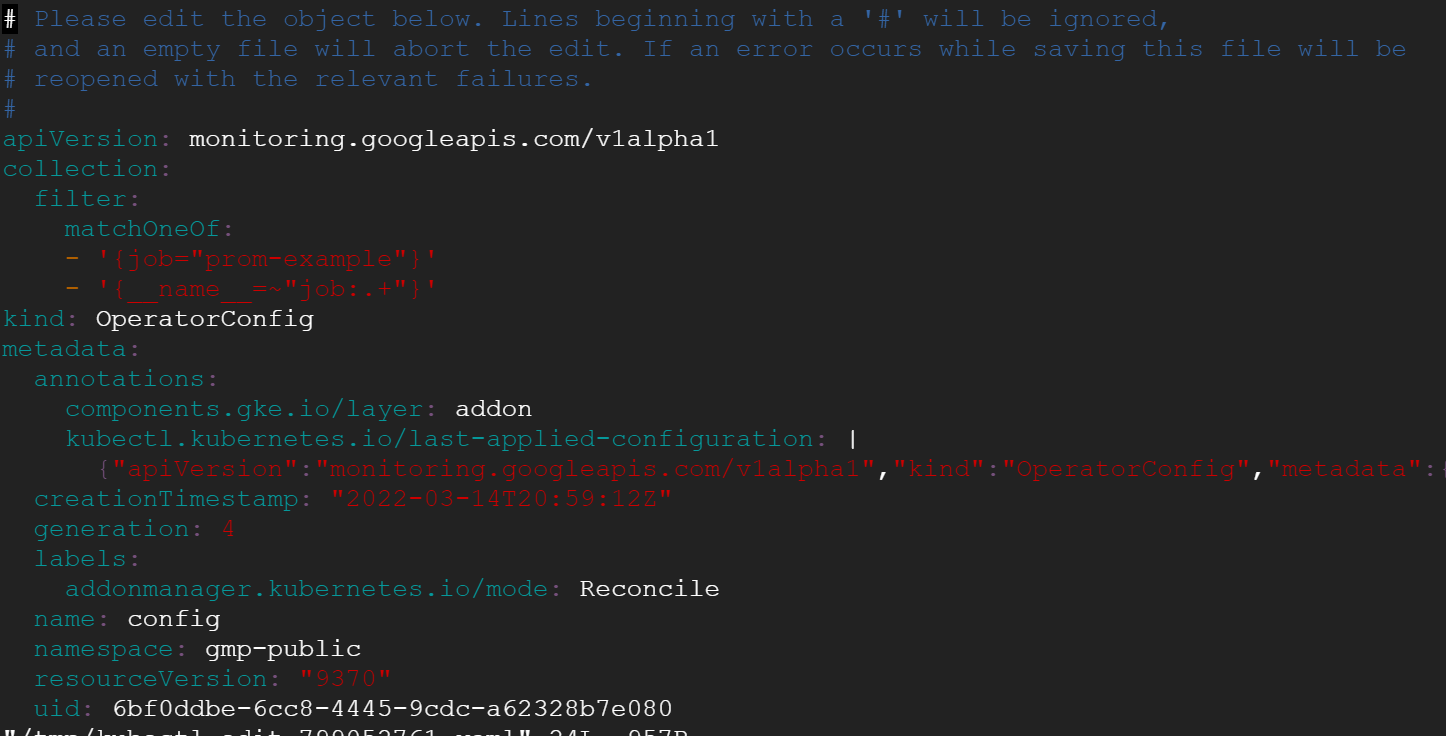
- 按 Esc 鍵並輸入「:wq」,接著按下 Enter 鍵,即可儲存檔案並退出。
加入這項設定後,系統只會匯出「prometheus」工作指標,以及依工作層級彙整的記錄規則所產生的指標 (前提是遵循命名最佳做法)。其他時間序列的樣本則會遭到篩除。根據預設,系統不會指定任何選取器,且會匯出所有時間序列。
filter.matchOneOf 設定區段的語意與 Prometheus 聯盟的 match[] 參數相同。
- 建立
op-config.yaml 檔案:
vi op-config.yaml
- 將下列內容複製到
op-config.yaml 檔案:
apiVersion: monitoring.googleapis.com/v1alpha1
collection:
filter:
matchOneOf:
- '{job="prom-example"}'
- '{__name__=~"job:.+"}'
kind: OperatorConfig
metadata:
annotations:
components.gke.io/layer: addon
kubectl.kubernetes.io/last-applied-configuration: |
{"apiVersion":"monitoring.googleapis.com/v1alpha1","kind":"OperatorConfig","metadata":{"annotations":{"components.gke.io/layer":"addon"},"labels":{"addonmanager.kubernetes.io/mode":"Reconcile"},"name":"config","namespace":"gmp-public"}}
creationTimestamp: "2022-03-14T22:34:23Z"
generation: 1
labels:
addonmanager.kubernetes.io/mode: Reconcile
name: config
namespace: gmp-public
resourceVersion: "2882"
uid: 4ad23359-efeb-42bb-b689-045bd704f295
- 上傳您建立的設定檔進行驗證:
export PROJECT=$(gcloud config get-value project)
gsutil mb -p $PROJECT gs://$PROJECT
gsutil cp op-config.yaml gs://$PROJECT
gsutil -m acl set -R -a public-read gs://$PROJECT
確認是否已套用指標篩選條件
工作 6:執行查詢
-
點選「+ Add query」來建立新的「Query」,並在「Select a metric」輸入篩選器輸入 up/gauge。
-
選取 Prometheus 指標結果,然後選取「Apply」。
工作 7:監控應用程式
- 建立 prom-example-config.yaml 檔案進行驗證:
vi prom-example-config.yaml
- 將下列內容複製到檔案中:
apiVersion: monitoring.googleapis.com/v1alpha1
kind: PodMonitoring
metadata:
annotations:
kubectl.kubernetes.io/last-applied-configuration: |
{"apiVersion":"monitoring.googleapis.com/v1alpha1","kind":"PodMonitoring","metadata":{"annotations":{},"labels":{"app.kubernetes.io/name":"prom-example"},"name":"prom-example","namespace":"gmp-test"},"spec":{"endpoints":[{"interval":"30s","port":"metrics"}],"selector":{"matchLabels":{"app":"prom-example"}}}}
creationTimestamp: "2022-03-14T22:33:55Z"
generation: 1
labels:
app.kubernetes.io/name: prom-example
name: prom-example
namespace: gmp-test
resourceVersion: "2648"
uid: c10a8507-429e-4f69-8993-0c562f9c730f
spec:
endpoints:
- interval: 60s
port: metrics
selector:
matchLabels:
app: prom-example
status:
conditions:
- lastTransitionTime: "2022-03-14T22:33:55Z"
lastUpdateTime: "2022-03-14T22:33:55Z"
status: "True"
type: ConfigurationCreateSuccess
observedGeneration: 1
- 在 Cloud Shell 執行下列指令。
export PROJECT=$(gcloud config get-value project)
gsutil cp prom-example-config.yaml gs://$PROJECT
gsutil -m acl set -R -a public-read gs://$PROJECT
確認是否已變更抓取間隔
實驗室到此結束。
恭喜
您已瞭解如何降低 Managed Service for Prometheus 的使用成本。您部署了 Prometheus 和範例應用程式,接著套用指標篩選器並變更抓取間隔,降低使用 Google Managed Prometheus 服務擷取指標的相關費用。
後續步驟/瞭解詳情
Google Cloud 教育訓練與認證
協助您瞭解如何充分運用 Google Cloud 的技術。我們的課程會介紹專業技能和最佳做法,讓您可以快速掌握要領並持續進修。我們提供從基本到進階等級的訓練課程,並有隨選、線上和虛擬課程等選項,方便您抽空參加。認證可協助您驗證及證明自己在 Google Cloud 技術方面的技能和專業知識。
使用手冊上次更新日期:2025 年 2 月 17 日
實驗室上次測試日期:2025 年 2 月 17 日
Copyright 2026 Google LLC 保留所有權利。Google 和 Google 標誌是 Google LLC 的商標,其他公司和產品名稱則有可能是其關聯公司的商標。


