실습 설정 안내 및 요구사항
계정과 진행 상황을 보호하세요. 이 실습을 실행하려면 항상 시크릿 브라우저 창과 실습 사용자 인증 정보를 사용하세요.

Configure Logging and Monitoring Agents for an Enterprise Windows Application

실습 1시간 30분 universal_currency_alt 크레딧 5개 show_chart 입문
info 이 실습에는 학습을 지원하는 AI 도구가 통합되어 있을 수 있습니다.
이 콘텐츠는 아직 휴대기기에 최적화되지 않음
최상의 경험을 위해 데스크톱 컴퓨터에서 이메일로 전송된 링크를 사용하여 방문하세요.

Overview

In this lab, you will learn how to install the Cloud logging and monitoring agents on Windows VMs.

Objectives

In this lab, you will learn how to:

  • Create service accounts with appropriate role assignments so that the agents installed on your VMs can write log entries and metrics into Cloud Monitoring.
  • Install the Windows Cloud Monitoring agents for logging and monitoring.

Setup and requirements

For each lab, you get a new Google Cloud project and set of resources for a fixed time at no cost.

  1. Sign in to Google Skills using an incognito window.

  2. Note the lab's access time (for example, 1:15:00), and make sure you can finish within that time. There is no pause feature. You can restart if needed, but you have to start at the beginning.

  3. When ready, click Start lab.

  4. Note your lab credentials (Username and Password). You will use them to sign in to the Google Cloud Console.

  5. Click Open Google Console.

  6. Click Use another account and copy/paste credentials for this lab into the prompts. If you use other credentials, you'll receive errors or incur charges.

  7. Accept the terms and skip the recovery resource page.

Task 1. Configure service accounts and role assignments

It's a best practice to create service accounts for your VMs, and to assign those accounts the minimal set of roles required for the VMs to perform their jobs. In this task, you'll create a service accounts and assign them only the roles required to write log entries and metrics data into Cloud Monitoring.

  1. In Google Cloud Console, from the navigation menu (Navigation menu icon) , select IAM & Admin > Service Accounts.
  2. Click CREATE SERVICE ACCOUNT. This account will be used by your Windows VM.
  3. Name the service account windows-servers.
  4. Click CREATE AND CONTINUE.
  5. Assign the Logging > Logs Writer role to the service account.
  6. Click + ADD ANOTHER ROLE.
  7. Assign the Monitoring > Monitoring Metric Writer role to the service account.
  8. Click CONTINUE.
  9. Click DONE. This account will be used for the Windows VM you create.

Click Check my progress to verify the objective. Configure service accounts

Task 2. Create the VMs

In this task, you'll create a Windows VM. You will configure the VM to use an appropriate service account that will allow the installed agents to write their data to Cloud Monitoring.

Create Windows VM

  1. In the VM instances page, click CREATE INSTANCE to create your Windows VM.
  2. Configure your VM with the following settings (leave other settings at defaults):
Property Value
Name windows-server
Region us-central1
Zone us-central1-a
Boot disk Click Change, select Operating system: Windows server and version: Windows Server 2019 Datacenter Core then click Select.
Identity and API accesss > Service account windows-servers
Allow HTTP traffic Enabled
  1. Click Create.

You may continue on to Task 3 while the Windows VM finishes starting.

Click Check my progress to verify the objective. Create the VMs

Task 3. Install, configure, and test Ops Agent

In this task, you will install the Cloud Ops Agent on your VM. The Ops Agent is the primary agent for collecting telemetry from your Compute Engine instances. Combining logging and metrics into a single agent, the Ops Agent uses Fluent Bit for logs, which supports high-throughput logging, and the OpenTelemetry Collector for metrics. You will check the VM logs before and after agent installation to see how installing the agent results in more logs being recorded.

Investigate log entries before agent installation

  1. In Google Cloud Console, from the navigation menu, select Logging.
  2. In Resource dropdown, select VM Instance and click Apply.
  3. In Log name dropdown, view the log types available. Leave it as default and click on Run Query.
  4. Note the current log entries. There are only audit log entries, detailing actions such as creating the VMs. There are no syslog entries, Apache log entries, etc.

Configure remote Windows management

  1. From your main browser window (not in Incognito mode), download Spark View RDP from Chrome Web Store. Once you navigate to the download page, click on the Add to Chrome button. Click on Add Extension in case of any pop-ups.
  2. In the VM instances screen, click the drop-down next to RDP in the Connect column of the VM listing; select Set Windows password.
  3. In the Set new Windows password modal dialog, click Set. Note the username and the password; you will need to use them later. (You can copy/paste into a text editor or note-taking app, or write them down.)

Install the Cloud Ops Agent on the Windows server

  1. Open the Spark RDP application.
  2. Enter the external IP address of the windows-server instance in the Computer field.
  3. Then enter your Windows user name and password. Leave other field at default.
  4. Click on Connect.
Note: For more details regarding the RDP connection, refer to the Connect to Linux VMs using Google tools guide.
  1. Open Powershell by entering the following at the Windows command prompt:
powershell
  1. In Powershell, enter the following to download and install the agent:
(New-Object Net.WebClient).DownloadFile("https://dl.google.com/cloudagents/add-google-cloud-ops-agent-repo.ps1", "${env:UserProfile}\add-google-cloud-ops-agent-repo.ps1") Invoke-Expression "${env:UserProfile}\add-google-cloud-ops-agent-repo.ps1 -AlsoInstall"
  1. Press Ctrl+Alt+Del (for macOS Command+Option+Delete).

  2. Choose Sign out and close the Spark RDP window.

  3. In the VM instances window, reset the window-server instance.

Verify that the Ops Agent is generating log entries

  1. In Google Cloud Console, from the navigation menu, select Monitoring > Dashboard.
  2. In the table of dashboards, locate the VM Instances entry, and then click on the name. The Inventory tab on the VM Instances dashboard lists all VMs and includes a status column for your agent, as shown in the following screenshot:

A list of VM instances

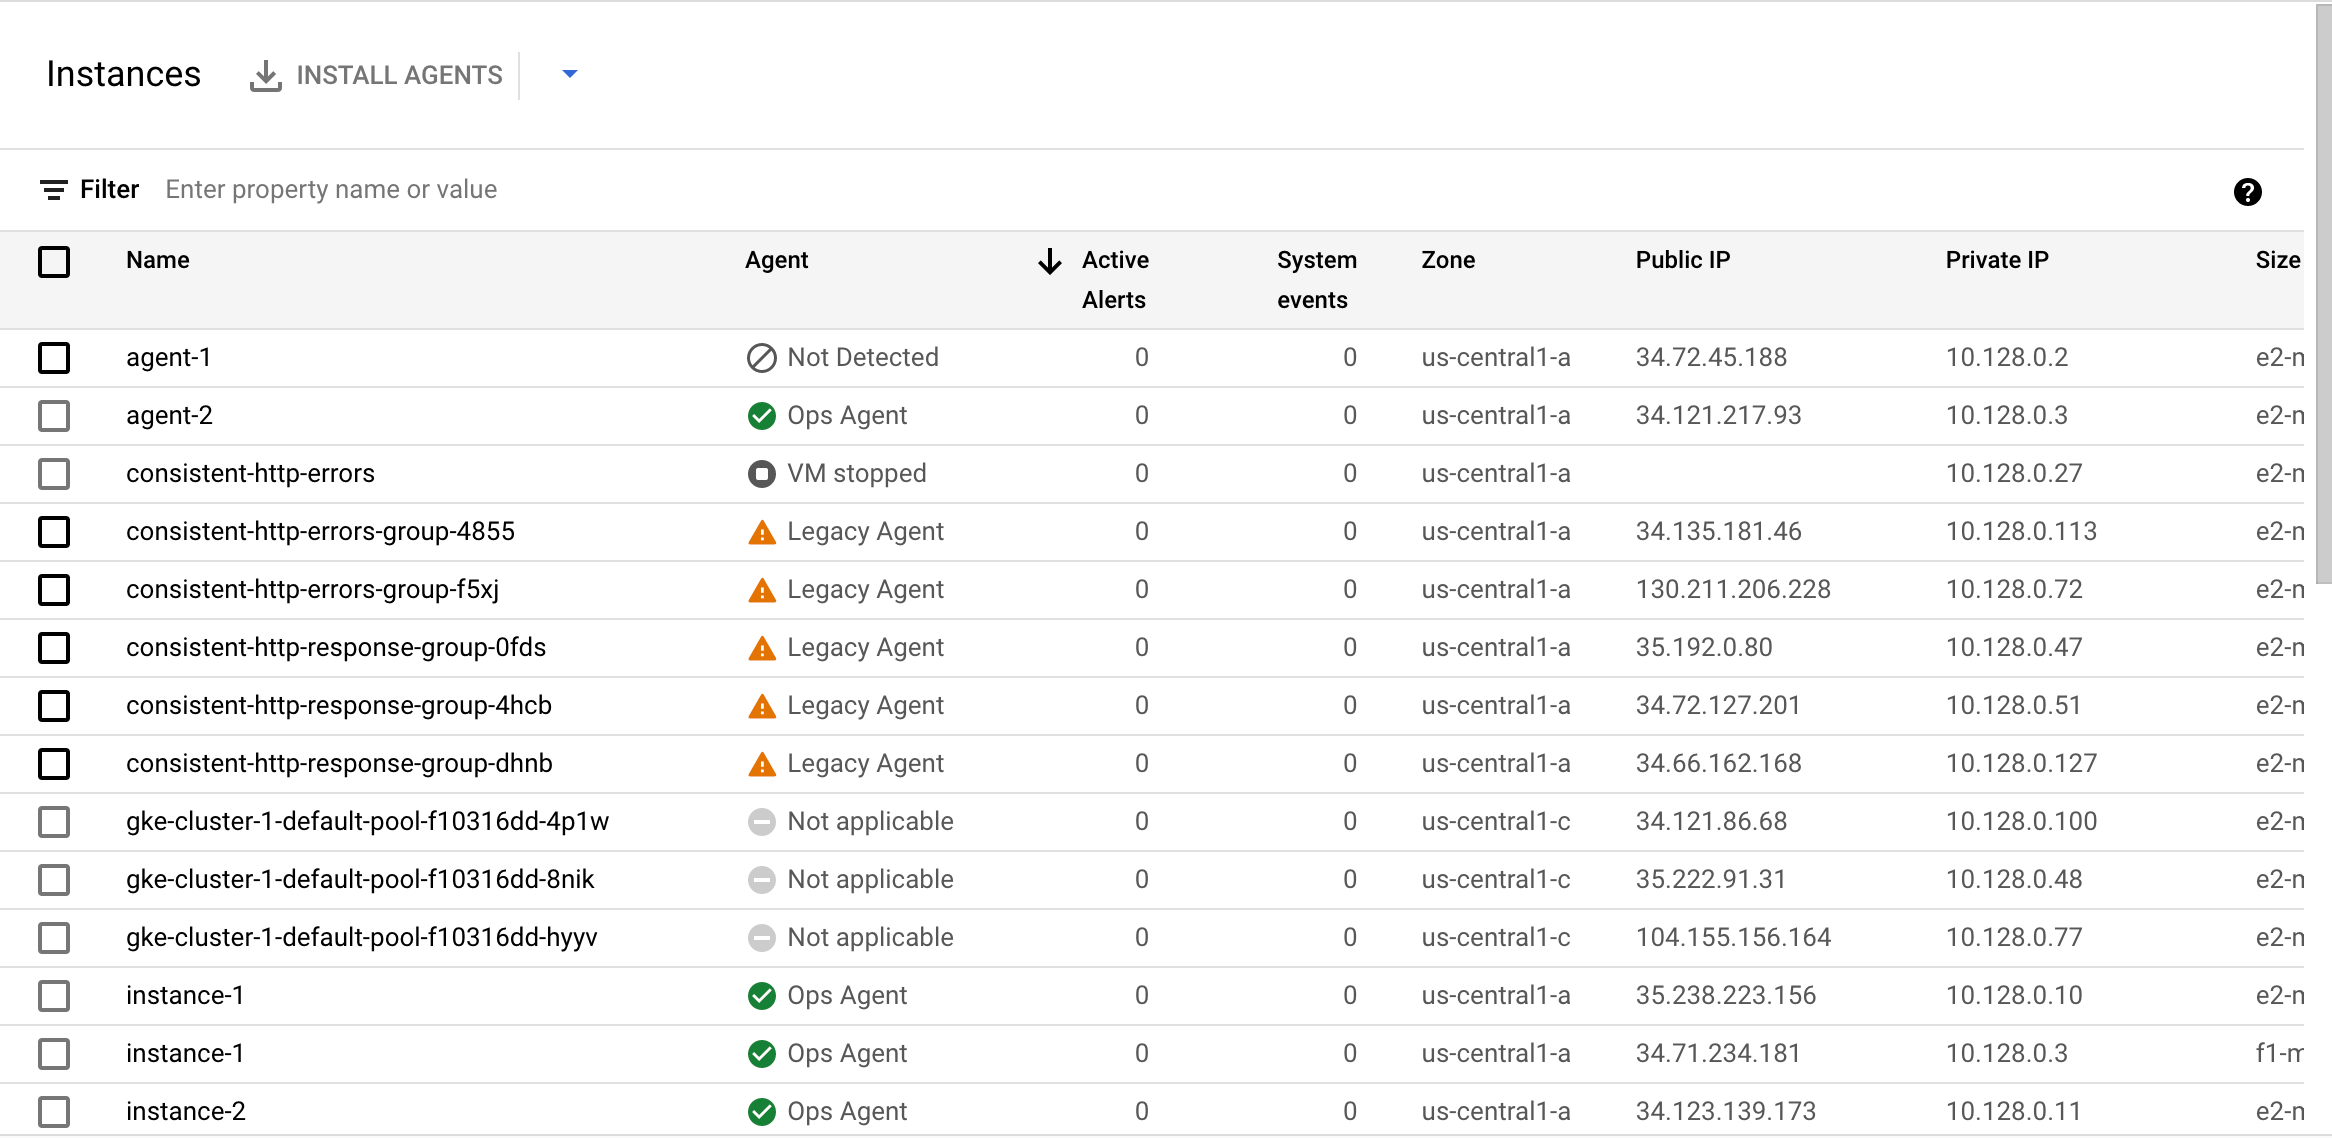
The Agent column reports the following values:

  • Not detected: You don't have an agent installed. If Cloud Monitoring doesn't detect any agents installed on the Compute Engine instance, then you can install an agent by doing the following:
  1. Select the VM instances on which you want to install agents.
  2. Click the Install agents option on the Instances table, which brings up an installation workflow in the dashboard, and follow the instructions. The Ops Agent is the default agent that is installed, but the installation workflow provides a link to install the legacy agents.

The Ops Agent collects both metrics and logs by default. You can change this default behavior by configuring the Ops Agent.

  • Ops Agent: You are running the Ops Agent.

  • Legacy agent: You are running the legacy Monitoring or the Logging agent. See Migrating from the legacy agents to the Ops Agent for information on transitioning to the Ops Agent.

  • Not applicable: This VM is not a supported platform for running the agent.

  • VM stopped: The VM is not running, so the agent's status is not known.

Review

In this lab, you had the chance to do the following:

  1. Create service accounts
  2. Assign roles
  3. Create a Windows VM configured to run with user-created service accounts
  4. Install the Cloud Ops agent on a Windows VM
  5. Explore agent-populated logs

Also, keep in mind that Cloud Logging can collect logs and metrics data from non-GCP systems. Google provides Cloud Monitoring agents that can be installed on AWS EC2 instances, and you can install fluentd and collectd agents on on-premise machines, enabling them to write data to the Cloud Monitoring service.

End your lab

When you have completed your lab, click End Lab. Google Skills removes the resources you’ve used and cleans the account for you.

You will be given an opportunity to rate the lab experience. Select the applicable number of stars, type a comment, and then click Submit.

The number of stars indicates the following:

  • 1 star = Very dissatisfied
  • 2 stars = Dissatisfied
  • 3 stars = Neutral
  • 4 stars = Satisfied
  • 5 stars = Very satisfied

You can close the dialog box if you don't want to provide feedback.

For feedback, suggestions, or corrections, please use the Support tab.

Copyright 2026 Google LLC All rights reserved. Google and the Google logo are trademarks of Google LLC. All other company and product names may be trademarks of the respective companies with which they are associated.

시작하기 전에

  1. 실습에서는 정해진 기간 동안 Google Cloud 프로젝트와 리소스를 만듭니다.
  2. 실습에는 시간 제한이 있으며 일시중지 기능이 없습니다. 실습을 종료하면 처음부터 다시 시작해야 합니다.
  3. 화면 왼쪽 상단에서 실습 시작을 클릭하여 시작합니다.

시크릿 브라우징 사용

  1. 실습에 입력한 사용자 이름비밀번호를 복사합니다.
  2. 비공개 모드에서 콘솔 열기를 클릭합니다.

콘솔에 로그인

    실습 사용자 인증 정보를 사용하여
  1. 로그인합니다. 다른 사용자 인증 정보를 사용하면 오류가 발생하거나 요금이 부과될 수 있습니다.
  2. 약관에 동의하고 리소스 복구 페이지를 건너뜁니다.
  3. 실습을 완료했거나 다시 시작하려고 하는 경우가 아니면 실습 종료를 클릭하지 마세요. 이 버튼을 클릭하면 작업 내용이 지워지고 프로젝트가 삭제됩니다.

현재 이 콘텐츠를 이용할 수 없습니다

이용할 수 있게 되면 이메일로 알려드리겠습니다.

감사합니다

이용할 수 있게 되면 이메일로 알려드리겠습니다.

한 번에 실습 1개만 가능

모든 기존 실습을 종료하고 이 실습을 시작할지 확인하세요.

시크릿 브라우징을 사용하여 실습 실행하기

이 실습을 실행하는 가장 좋은 방법은 시크릿 모드 또는 시크릿 브라우저 창을 사용하는 것입니다. 개인 계정과 학생 계정 간의 충돌로 개인 계정에 추가 요금이 발생하는 일을 방지해 줍니다.