
Before you begin
- Labs create a Google Cloud project and resources for a fixed time
- Labs have a time limit and no pause feature. If you end the lab, you'll have to restart from the beginning.
- On the top left of your screen, click Start lab to begin
Create a custom measure
/ 80
Use the table calculations
/ 20
Create a custom measure
/ 80
Use the table calculations
/ 20

Looker 可讓非開發人員使用者建立及使用臨時欄位,取得更豐富的資料分析結果。方法是建立自訂測量指標、自訂維度、資料表計算,並使用自訂分組,根據特定條件縮小資料範圍。
非開發人員可使用臨時欄位建立新欄位,但如果是一般欄位,使用者必須擁有開發權限,並對 LookML 有所瞭解。臨時欄位可讓使用者更靈活地獨立尋找所需資料。
本實驗室的學習內容包括:
請詳閱以下操作說明。實驗室活動會計時,且中途無法暫停。點選「Start Lab」後就會開始計時,顯示可使用 Google Cloud 資源的時間。
您將在真正的雲端環境中完成實作實驗室活動,而不是在模擬或示範環境。為達此目的,我們會提供新的暫時憑證,讓您用來在研究室活動期間登入及存取 Google Cloud。
如要完成這個研究室活動,請先確認:
準備就緒後,請點選「Start Lab」。
「Lab Details」窗格會顯示本實驗室中必須使用的暫時憑證。
如果實驗室會產生費用,畫面中會出現選擇付款方式的彈出式視窗。
請在「Lab Details」窗格查看實驗室憑證,您之後會使用此憑證登入實驗室的 Looker 執行個體。
點選「Open Looker」。
分別在「Email」和「Password」欄位,輸入提供的使用者名稱和密碼。
使用者名稱:
密碼:
點選「Log In」。
成功登入後,您就會在本實驗室看到 Looker 執行個體。
在本節中,您將根據現有維度建立自訂測量指標。
首先,在 Looker 使用者介面左下方,按一下切換鈕進入「開發模式」。
按一下「探索」分頁標籤,然後依序選取「電子商務訓練」>「訂單商品」。
展開「庫存商品」部分。
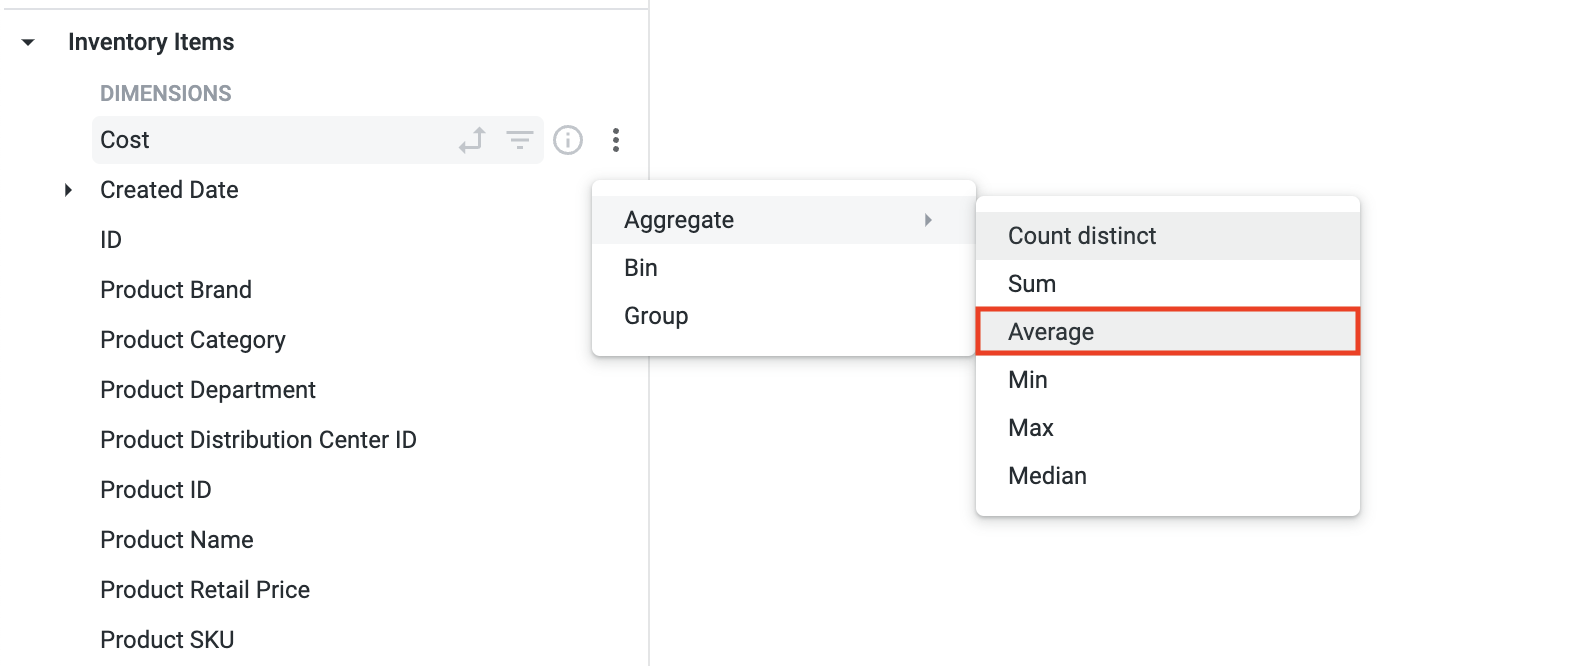
按一下「費用」維度旁的「更多」圖示 (
依序選取「匯總」>「平均值」自訂欄位,建立可計算訂購商品平均費用的測量指標。
建議的函式會因所選維度類型 (例如數字、文字和日期) 而異。如果選取「count」,系統會在產生的 SQL 中執行 count distinct。新欄位會自動新增至查詢。
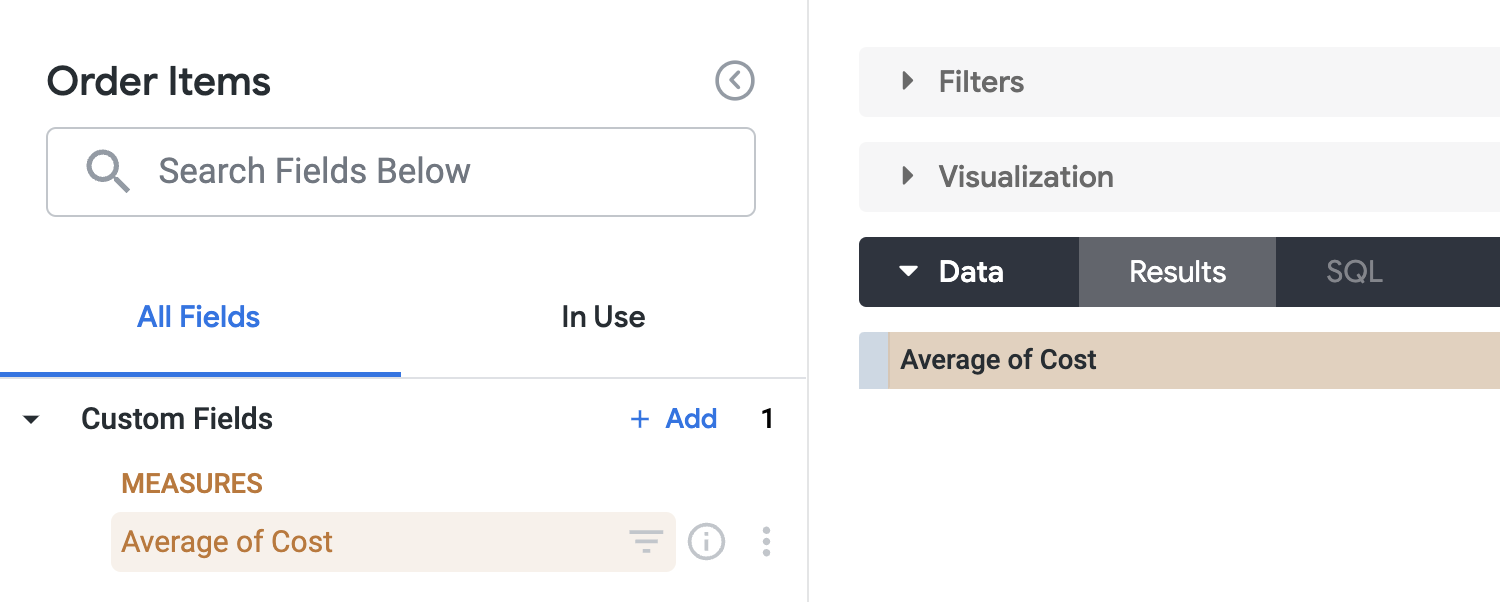
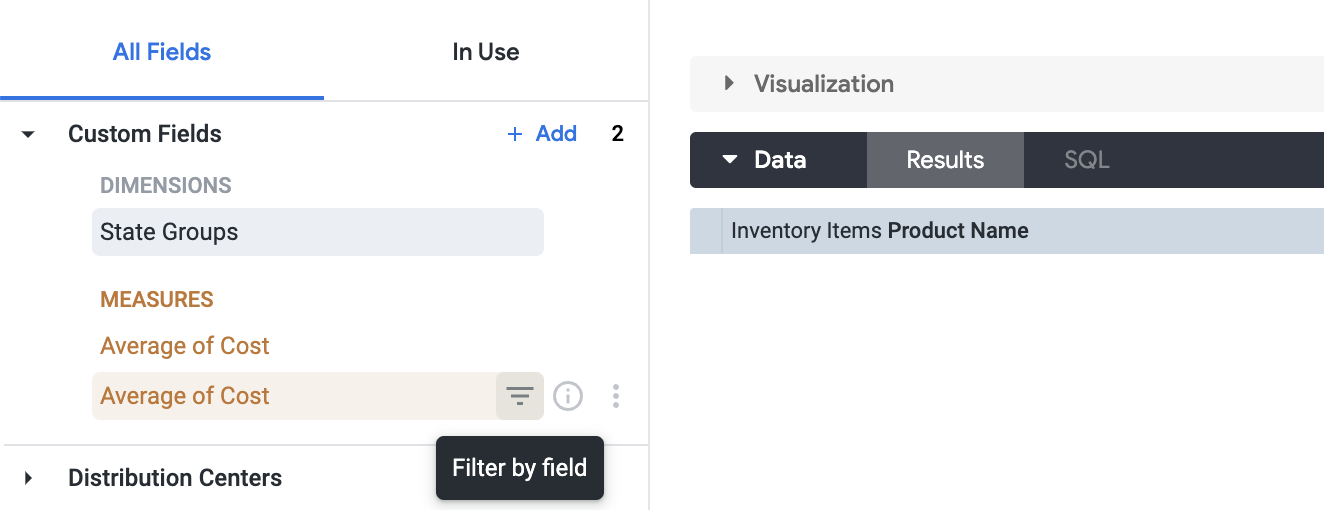
展開「自訂欄位」部分,即可查看新欄位。
與其他欄位一樣,您可以點按自訂欄位的名稱,在查詢中新增或移除該欄位。您也可以將游標懸停在欄位上,查看該欄位適用的其他選項,包括按一下「依欄位篩選」圖示,在查詢中將欄位做為篩選條件使用。
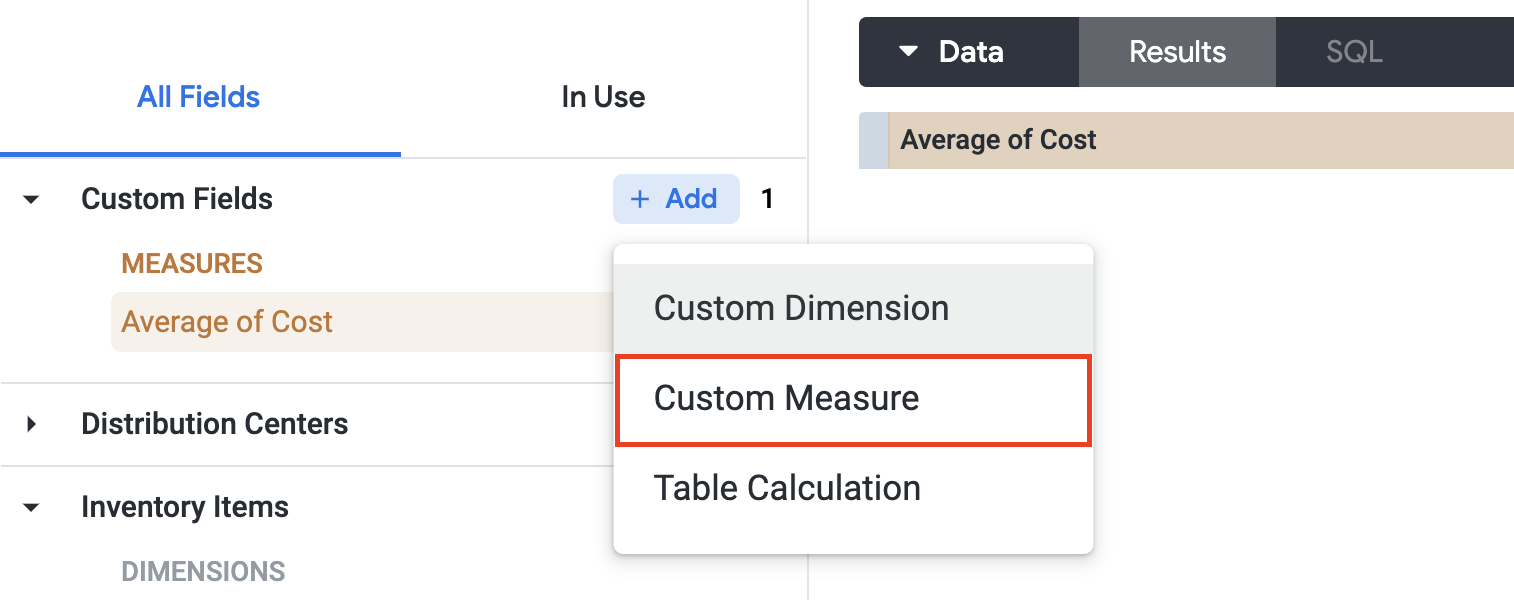
如要在建立自訂測量指標時定義格式或篩選條件,請先按一下「自訂欄位」部分中的「+ 新增」按鈕。
展開「自訂欄位」部分。
按一下「+ 新增」,然後選取「自訂度量」。
將「要度量的欄位」設為「庫存商品」>「費用」。
將「度量類型」設為「平均值」。
將「名稱」設為「平均費用」。
在「欄位詳細資料」分頁中,設定下列項目:
格式:美元
小數:2
使用「群組」自訂欄位類型,即可替維度和自訂維度建立臨時自訂群組,不必在 Looker 運算式中使用邏輯函式,或是在 SQL 參數或「type: case」欄位中開發 CASE WHEN 邏輯。
如果想為符合特定條件的值指派固定標籤或類別名稱,例如將特定州或國家/地區歸類至區域,或將訂單費用歸類至類別,這項功能就相當實用。
現在「自訂欄位」部分應該會顯示兩個「平均費用」自訂欄位。選取最下方的項目,即可將其新增至查詢。
展開「庫存商品」部分,然後選取「產品名稱」維度,將其新增至查詢。
展開「使用者」部分,然後選取「國家/地區」維度的「依欄位篩選」圖示,將下拉式選單設為「等於」,並將值設為「美國」。
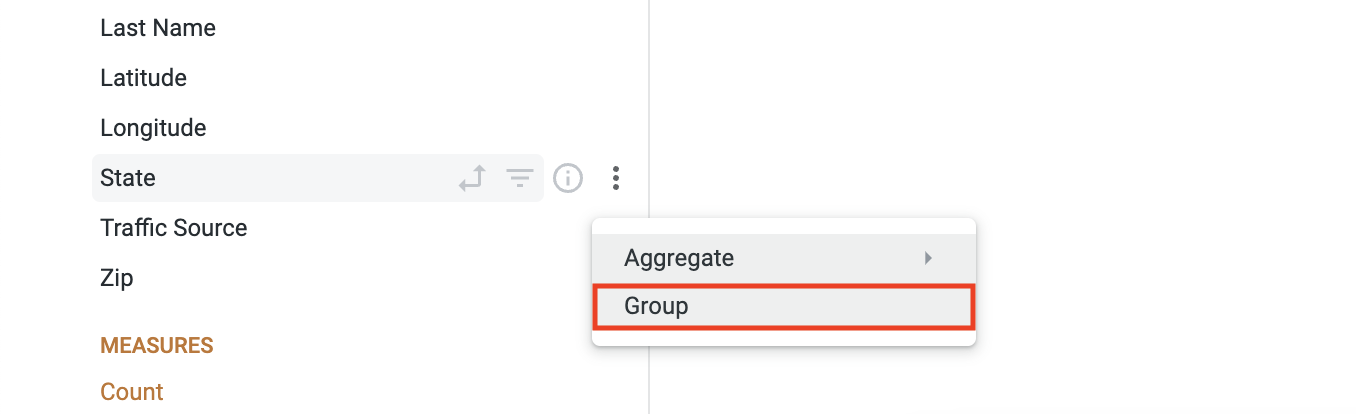
接著,在「使用者」部分下方,按一下「狀態」旁的「更多」圖示 (
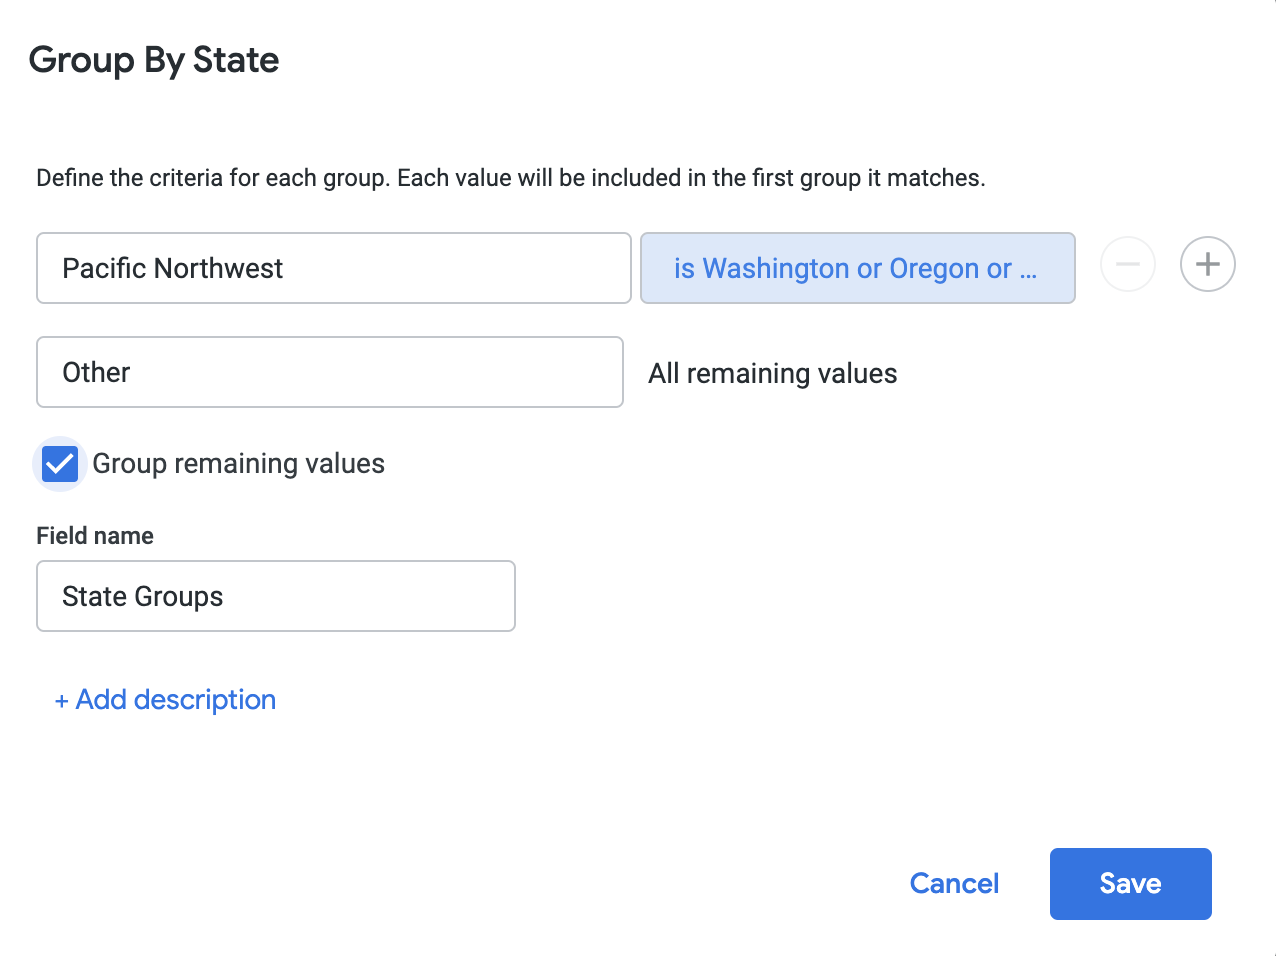
在「依州分組」對話方塊中,將「新增群組名稱」設為「太平洋西北部」。
按一下「是任何值」輸入框,然後將「奧勒岡州」、「愛達荷州」和「華盛頓州」逐一新增至清單。
勾選「群組剩下的值」核取方塊,然後按一下「儲存」。
州群組」自訂欄位,將其新增至「探索」,然後按一下頁面右上方的「執行」。最後會看到依「太平洋西北部」和「其他」分組的各種產品名稱平均費用。
現在您已查看依「太平洋西北部」和「其他」分組的各種產品名稱平均費用,假設您只想查看平均費用超過 $200 美元的產品。
如要強化目前的檢視畫面,請按照以下步驟操作:
平均費用」,然後點按「依欄位篩選」圖示。將下拉式選單設為「大於」,然後將值設為「200」。
按一下頁面右上方的「執行」按鈕,重新執行查詢並查看結果。
系統會顯示篩選後的檢視畫面,只顯示平均費用大於 $200 美元的產品。
點選「Check my progress」,確認目標已達成。
假設您想瞭解上一節檢視畫面中每個項目的訂單數量。如要進一步篩選檢視畫面,可以新增「訂單數」,並使用「欄百分比」快速計算,利用先前在本實驗室建立的「州群組」自訂欄位,瞭解某項產品的熱門程度。
在「訂單商品」部分下方,按一下「訂單數」,將其新增至檢視畫面。
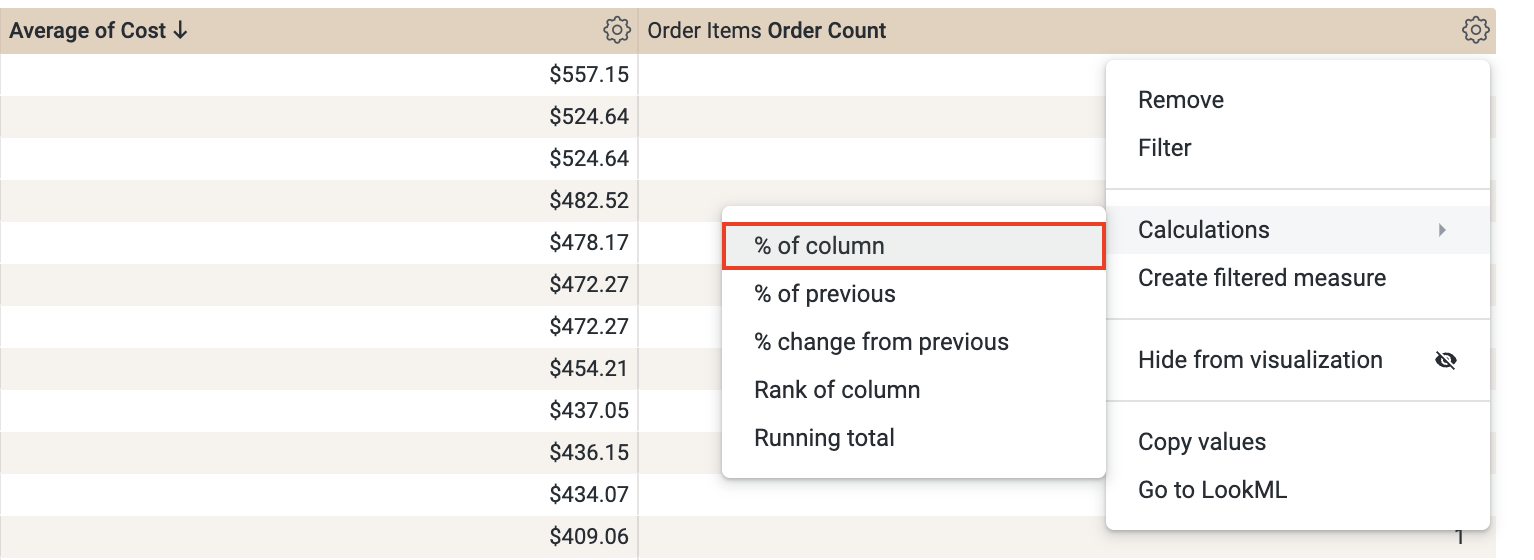
在資料檢視中,按一下「訂單數」欄中的「設定」圖示 (
依序點選「計算」>「資料欄百分比」。
「探索」中應會填入新的資料表計算欄,顯示訂單數百分比。
點選「Check my progress」,確認目標已達成。
在本實驗室中,您瞭解了如何定義及解讀核心 LookML 術語和概念。接著,您學到主要 LookML 結構和階層的編排方式,並建立 view、新增維度及測量指標,最後將檢視表彙整至現有探索。
協助您瞭解如何充分運用 Google Cloud 的技術。我們的課程會介紹專業技能和最佳做法,讓您可以快速掌握要領並持續進修。我們提供從基本到進階等級的訓練課程,並有隨選、線上和虛擬課程等選項,方便您抽空參加。認證可協助您驗證及證明自己在 Google Cloud 技術方面的技能和專業知識。
使用手冊上次更新日期:2022 年 7 月 25 日
實驗室上次測試日期:2022 年 4 月 20 日
Copyright 2026 Google LLC 保留所有權利。Google 和 Google 標誌是 Google LLC 的商標,其他公司和產品名稱則有可能是其關聯公司的商標。


This content is not currently available
We will notify you via email when it becomes available

Great!
We will contact you via email if it becomes available

One lab at a time
Confirm to end all existing labs and start this one
Complete this quick step to start your lab.