

Before you begin
- Labs create a Google Cloud project and resources for a fixed time
- Labs have a time limit and no pause feature. If you end the lab, you'll have to restart from the beginning.
- On the top left of your screen, click Start lab to begin
Deploy an application to App Engine
/ 50
Create an SLO and tie an alert to the SLO
/ 50
Deploy an application to App Engine
/ 50
Create an SLO and tie an alert to the SLO
/ 50
Google Cloud's Service Monitoring streamlines the creation of microservice Service Level Objectives (SLOs) based on availability, latency, or custom Service Level Indicators (SLIs). In this lab, you use Service Monitoring to create a 99.5% availability SLO and corresponding alert.
In this lab, you learn how to perform the following tasks:
For each lab, you get a new Google Cloud project and set of resources for a fixed time at no cost.
Click the Start Lab button. If you need to pay for the lab, a pop-up opens for you to select your payment method. On the left is the Lab Details panel with the following:
Click Open Google Cloud console (or right-click and select Open Link in Incognito Window if you are running the Chrome browser).
The lab spins up resources, and then opens another tab that shows the Sign in page.
Tip: Arrange the tabs in separate windows, side-by-side.
If necessary, copy the Username below and paste it into the Sign in dialog.
You can also find the Username in the Lab Details panel.
Click Next.
Copy the Password below and paste it into the Welcome dialog.
You can also find the Password in the Lab Details panel.
Click Next.
Click through the subsequent pages:
After a few moments, the Google Cloud console opens in this tab.

Google Cloud Shell is a virtual machine that is loaded with development tools. It offers a persistent 5GB home directory and runs on the Google Cloud.
Google Cloud Shell provides command-line access to your Google Cloud resources.
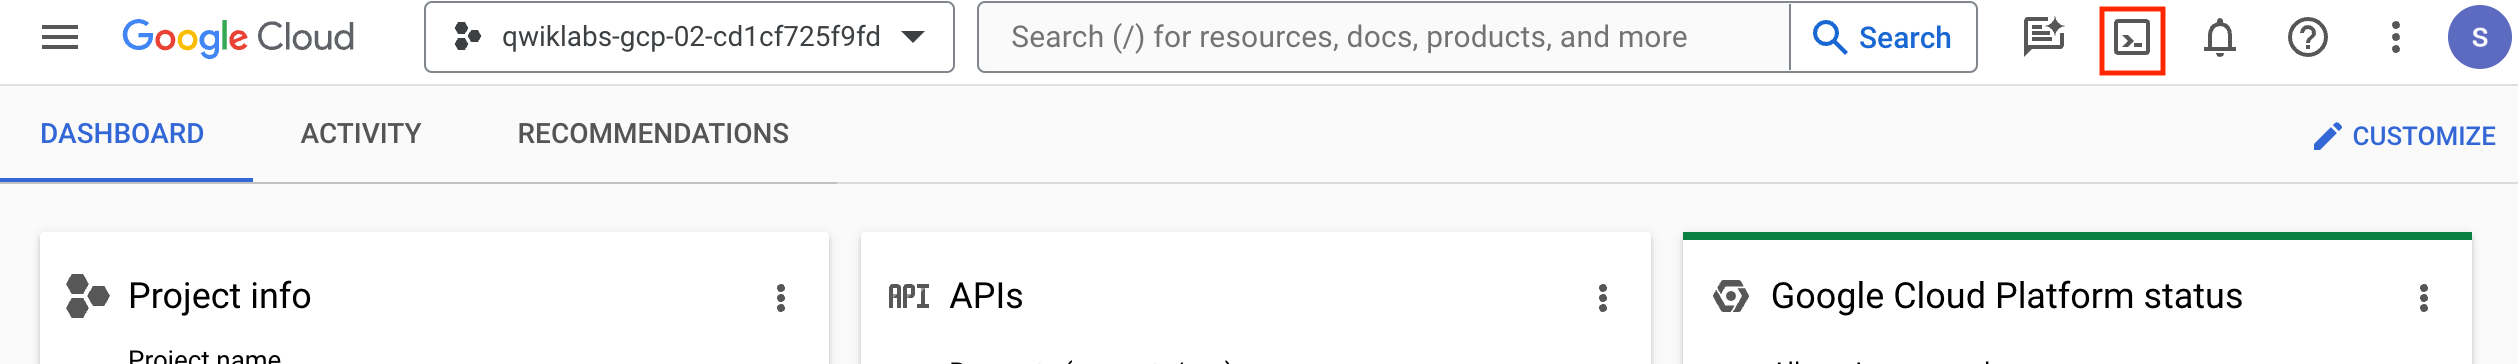
In Cloud console, on the top right toolbar, click the Open Cloud Shell button.
Click Continue.
It takes a few moments to provision and connect to the environment. When you are connected, you are already authenticated, and the project is set to your PROJECT_ID. For example:
gcloud is the command-line tool for Google Cloud. It comes pre-installed on Cloud Shell and supports tab-completion.
Output:
Example output:
Output:
Example output:
In this task, you deploy a test application to App Engine.
To have something for Service Monitoring to connect to, deploy a basic Node.js application to App Engine standard.
https://github.com/haggman/HelloLoggingNodeJS.git repo:This repository contains a basic Node.js web application used for testing. This is the same application you saw pieces of in the lecture module.
HelloLoggingNodeJS folder and open the index.js in the Cloud Shell code editor:Take a few minutes to peruse the code.
In the cloud shell code editor, look at the app.yaml file. And update the runtime nodejs version.
App Engine standard uses this file to define the runtime required by the application.
package.json file.Not only does this define the Node.js application dependencies, but it also defines the start script App Engine uses to serve requests.
Return to the Cloud Shell window. If the Cloud Shell is not visible, click Open Terminal.
In the Cloud Shell terminal, create a new App Engine app:
This must be done once in each new project that is running App Engine applications. App Engine is a regional technology, thus the region switch.
Wait until the deploy completes before moving on.
When prompted, type y and press Enter.
Copy the URL to your newly deployed app from the console (https://qwiklabs-gcp-****************.appspot.com) and open it in a new browser tab.
Verify a Hello World! response.
Click Check my progress to verify the objective.
In this task, you:
At the top of the Cloud Shell interface, press the Add icon to Open a new tab.
In the new tab, use a simple bash while loop to generate load on your application:
The loop generates ten requests per second. The URL is to the /random-error route, which generates an error about every 1000 requests, so you should see approximately 1 error every 100s.
We have a working App Engine application that is currently throwing an error approximately every 1000 requests. Imagine we want to create an availability SLO with a target of 99.5%, and an alert that will notify us if our SLO is in danger. That's exactly what Service Monitoring makes easy.
In the Google Cloud Console, use the Navigation menu (
Scroll down to the Server Errors section. Have any errors been generated yet? If not, wait a couple of minutes and refresh the page. You should see one every few minutes.
Use the Navigation menu to navigate to Error Reporting.
Notice the error is also being caught here. We will discuss Error Reporting in a later module.
It takes a moment for the monitoring workspace to create.
Once it loads, click SLOs.
Notice that Service Monitoring already sees your default App Engine application. "If it doesn't, wait a minute, refresh the page and click +Define a service, select default, and submit it."
Click the default App Engine application to drill into it.
Click +Create SLO to start the new SLO dialog.
Select the Availability metric, leave the evaluation method set to Request-based, and then click Continue.
Take a moment to investigate the details the SLI details displayed, then click Continue.
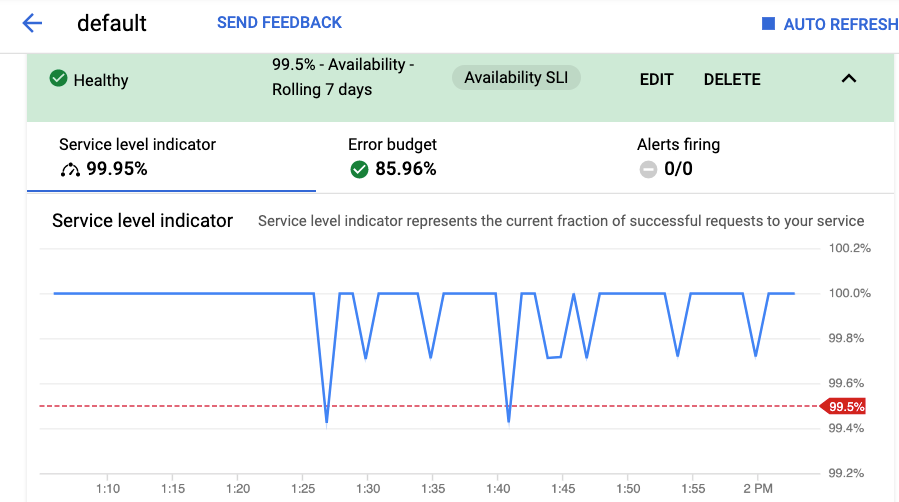
To define the SLO, set the Period type to Rolling and the Period length to 7 days to calculate the SLO on a constantly moving 7-day window of time.
Set the Goal to 99.5% and the charts fill in, though it's typically difficult to see that 99.5 to 99.9 difference.
Click the red dashed line, and the chart will zoom in to make things easier to see.
Click Continue, notice the default name, and submit the new SLO by clicking Create SLO.
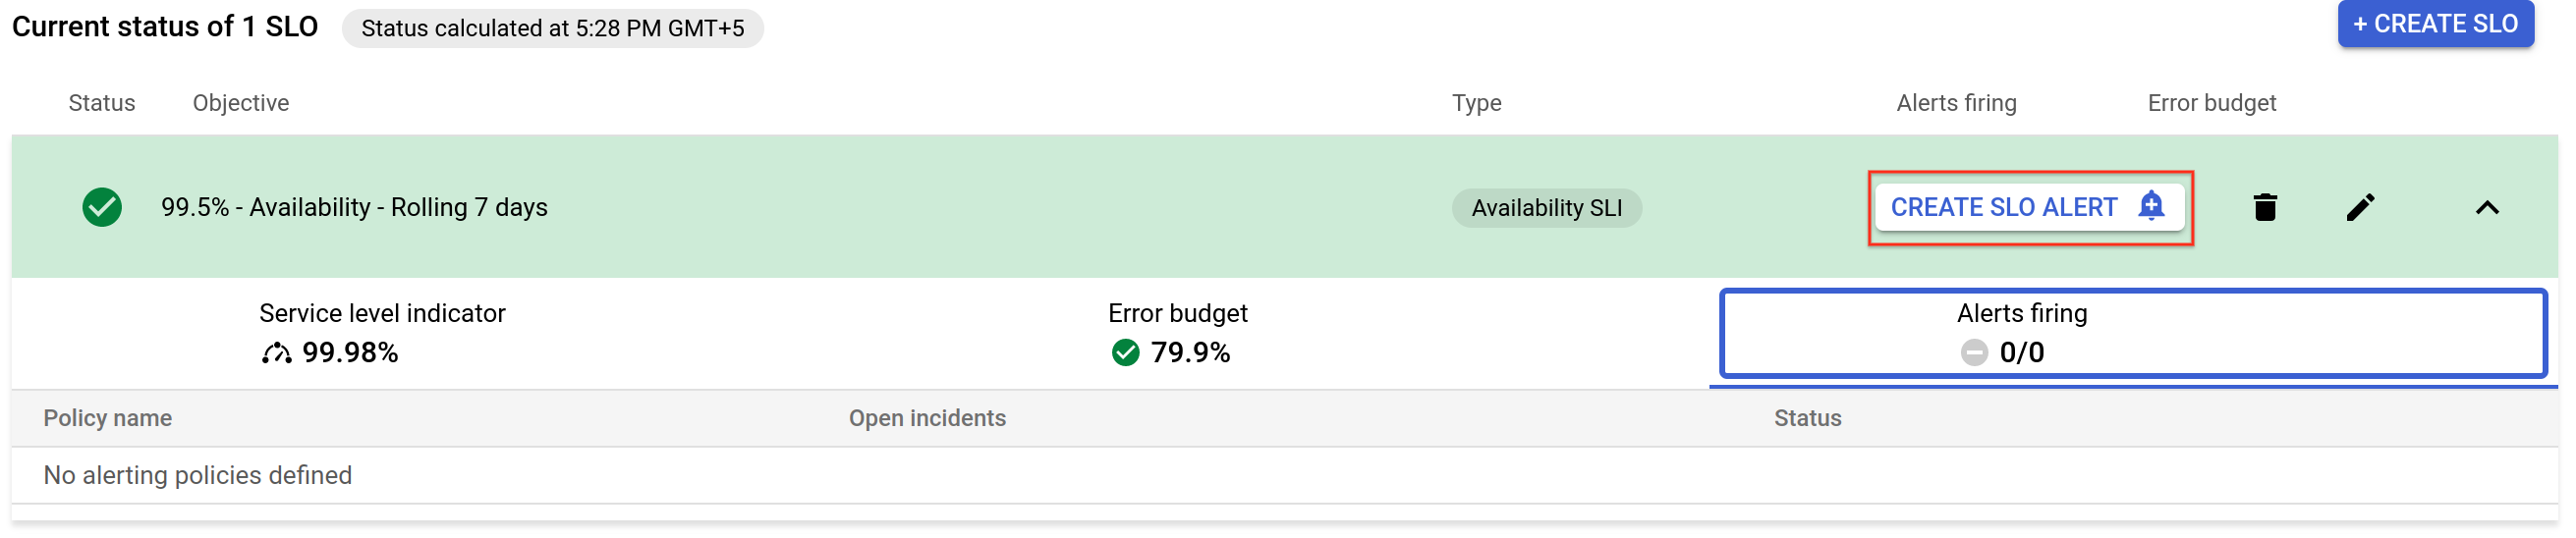
Current status of 1 SLO section, expand the new SLO and investigate the information it displays. Move between the three tabs, Service level indicator, Error budget, and Alerts firing, investigating each.The SLO has been created and so far, you are well within your objective. Since the SLO target is 99.5%, and the SLI should be showing a current measurement level of about 99.9%, that means that your application is using approximately 1/5 of its error budget, so the error budget should be displaying about 80%. If you start to burn through your error budget at an unexpectedly fast rate, it would be nice for an alert to fire to let you know.
There are several ways to create an alert for an SLO in Service Monitoring.
Set the Display name to Really short window test. Because you are doing a test and not setting values, that would make sense in production.
Set the Lookback duration to 10 minutes and the burn rate threshold to 1.5.
Click Next.
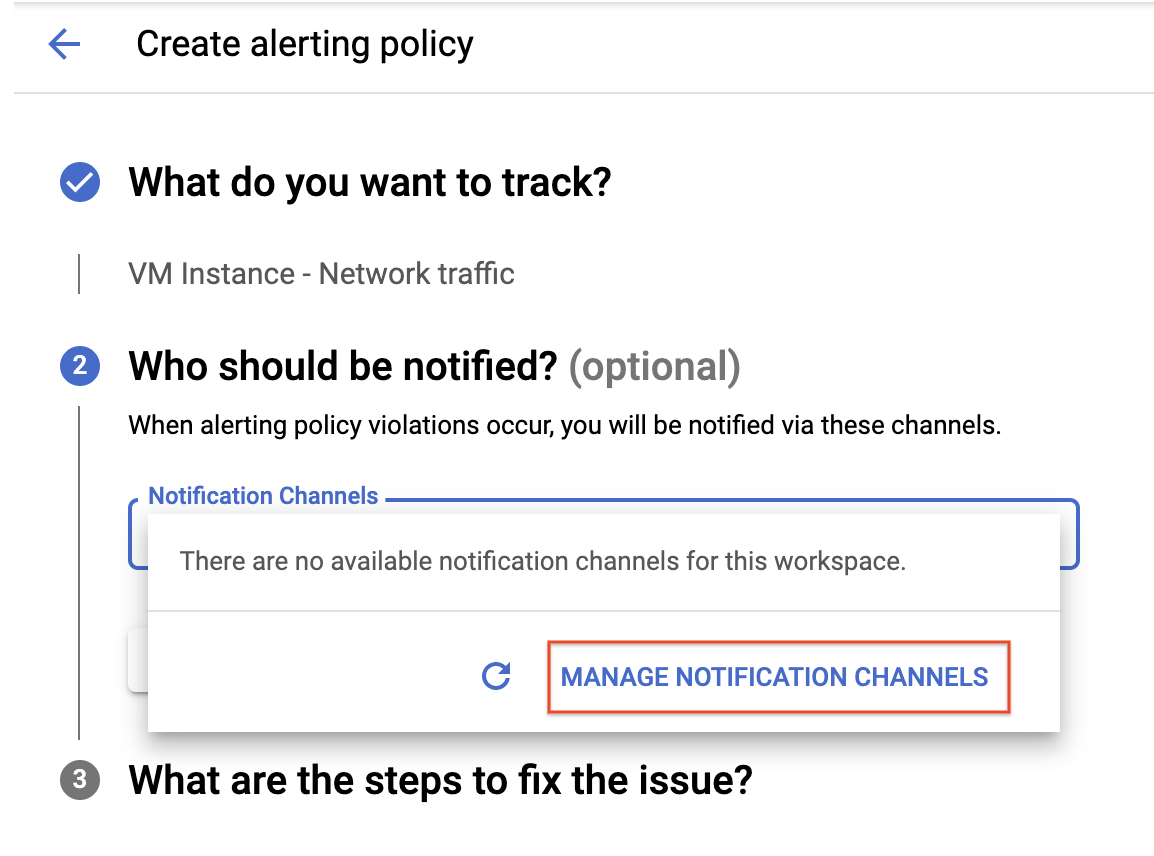
Click on drop down arrow next to Notification Channels, then click on Manage Notification Channels.
A Notification channels page will open in new tab.
Scroll down the page and click on ADD NEW for Email.
In Create Email Channel dialog box, enter your personal email address in the Email Address field and a Display name.
Click on Save.
For Who should be notified, use the Manage notification channels link to add your email address as a notification channel and select that. Remember, this link opens a new tab so close it once your email address has been added, and then Save the new alert.
Click on Notification Channels again, then click on the Refresh icon to get the display name you mentioned in the previous step.
Now, select your Display name and click OK.
Click Next.
Skip What are the steps to fix the issue? (optional) and click Save.
On the SLO page, switch back to the Service level indicator tab. It should not display our alert as a red dotted line.
Once again, clicking the line will zoom in the view. In the upper-right corner of the page, click Auto Refresh so the charts update automatically.
Modify our application and trigger the alert.
Switch back to your Cloud Shell view and Open Editor, if it's not already displayed, and re-open index.js.
Scroll to the /random-error route found at approximately line 126 and modify the value next to Math.random from 1000 to 20.
So instead of generating an error every 1000 requests, we are not going to get an error every 20 requests. That will drop our availability from 99.9$ to about 95%, which should trigger the alert.
You have two tabs, one that's running the test loop and one that's standard.
When prompted, type y and press Enter.
Once the redeploy completes, switch to the tab running the test loop and verify the uptick in errors.
Switch back to the your Service Monitoring page and in the upper-right corner, verify a green check next to auto refresh.
Verify that your SLO is expanded and that you can see the Service level indicator.
After a few minutes, the SLI value and chart should show clearly the decrease in performance down to about the 95% level. Within a few minutes, you should also receive the alert notification email.
Click Check my progress to verify the objective.
Congratulations! You used Service Monitoring to create an availability related SLO and corresponding alert. Nice job.
When you have completed your lab, click End Lab. Google Skills removes the resources you’ve used and cleans the account for you.
You will be given an opportunity to rate the lab experience. Select the applicable number of stars, type a comment, and then click Submit.
The number of stars indicates the following:
You can close the dialog box if you don't want to provide feedback.
For feedback, suggestions, or corrections, please use the Support tab.
Copyright 2026 Google LLC All rights reserved. Google and the Google logo are trademarks of Google LLC. All other company and product names may be trademarks of the respective companies with which they are associated.


This content is not currently available
We will notify you via email when it becomes available

Great!
We will contact you via email if it becomes available

One lab at a time
Confirm to end all existing labs and start this one
Complete this quick step to start your lab.