Overview
In this series of labs, you take a demo microservices Java application built with the Spring framework and modify it to use an external database server. You adopt some of the best practices for tracing, configuration management, and integration with other services using integration patterns.
In a microservices architecture, you need distributed tracing to make complicated service calls more visible. For example, when service A calls B, and B calls C, which service has a problem? In Spring Cloud GCP, you can easily add distributed tracing by using Spring Cloud Sleuth. Spring Cloud Sleuth typically requires you to run and operate your own Zipkin backend.
In this lab, you implement distributed tracing by using Spring Cloud GCP, Spring Cloud Sleuth, and Cloud Trace. Spring Cloud GCP provides a starter that can interoperate with Spring Cloud Sleuth, but it forwards the trace request to Cloud Trace instead.
Cloud Trace is a distributed tracing system that collects latency data from your applications and displays it in the Google Cloud console. You can track how requests propagate through your application and receive detailed, near-real-time performance insights. Cloud Trace automatically analyzes all traces of your application to generate in-depth latency reports to surface performance degradations. It can also capture traces from all of your VMs, containers, or App Engine projects.
Language-specific SDKs for Cloud Trace can analyze projects running on VMs, even projects not managed by Google Cloud. The Trace SDK is available for Java, Node.js, Ruby, and Go. Cloud Trace API can be used to submit and retrieve trace data from any source. A Zipkin collector is also available, which enables Zipkin tracers to submit data to Cloud Trace. Projects running on App Engine are automatically captured.
Objectives
In this lab, you learn how to perform the following tasks:
- Enable Cloud Trace API
- Use Spring to add Cloud Trace to your application
- Configure customized trace settings in an application
- Inspect the trace output
Setup and requirements
How to start your lab and sign in to the Console
-
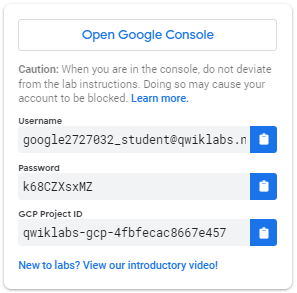
Click the Start Lab button. If you need to pay for the lab, a pop-up opens for you to select your payment method.
On the left is a panel populated with the temporary credentials that you must use for this lab.
-
Copy the username, and then click Open Google Console.
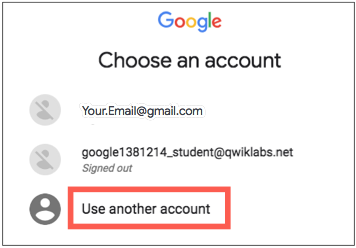
The lab spins up resources, and then opens another tab that shows the Choose an account page.
Note: Open the tabs in separate windows, side-by-side.
-
On the Choose an account page, click Use Another Account. The Sign in page opens.
-
Paste the username that you copied from the Connection Details panel. Then copy and paste the password.
Note: You must use the credentials from the Connection Details panel. Do not use your Google Skills credentials. If you have your own Google Cloud account, do not use it for this lab (avoids incurring charges).
- Click through the subsequent pages:
- Accept the terms and conditions.
- Do not add recovery options or two-factor authentication (because this is a temporary account).
- Do not sign up for free trials.
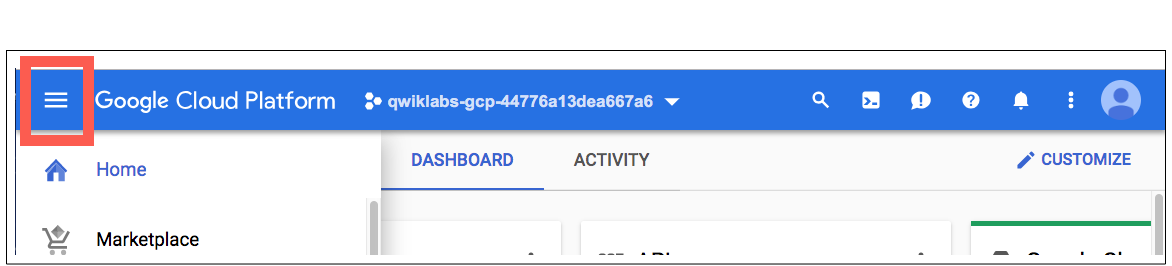
After a few moments, the Cloud console opens in this tab.
Note: You can view the menu with a list of Google Cloud Products and Services by clicking the Navigation menu at the top-left.
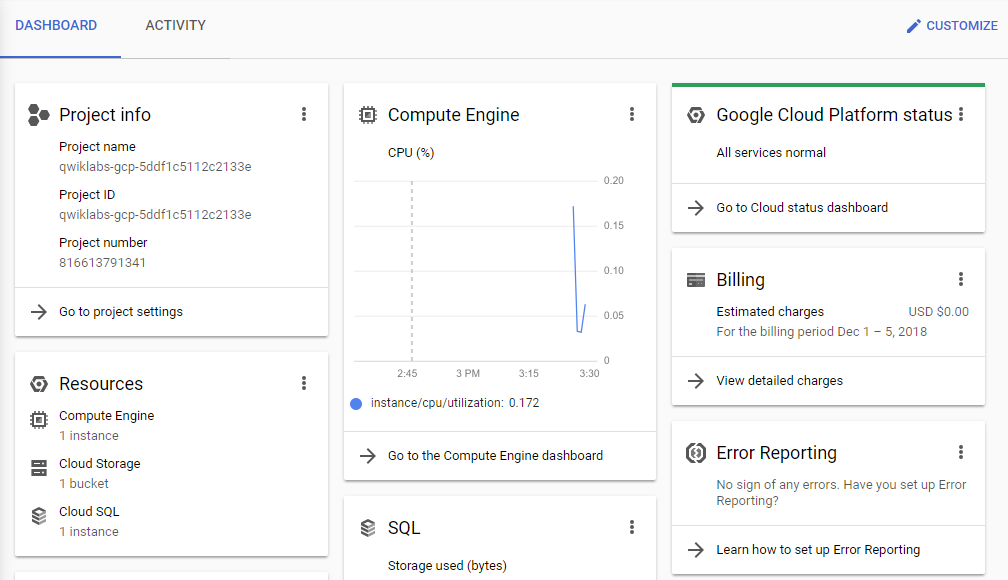
After you complete the initial sign-in steps, the project dashboard appears.
Task 1. Fetch the application source files
In this task, you clone the source repository files that are used throughout this lab.
-
To begin the lab, click the Activate Cloud Shell button at the top of the Google Cloud Console.
-
To activate the code editor, click the Open Editor button on the toolbar of the Cloud Shell window.
You can switch between Cloud Shell and the code editor by using Open Editor and Open Terminal icon as required.
Note: A Cloud Storage bucket that is named using the project ID for this lab is automatically created for you by the lab setup. The source code for your applications is copied into this bucket when the Cloud SQL server is ready. You might have to wait a few minutes for this action to complete.
- In Cloud Shell, enter the following command to create an environment variable that contains the project ID for this lab:
export PROJECT_ID=$(gcloud config list --format 'value(core.project)')
- Verify that the demo application files were created:
gcloud storage ls gs://$PROJECT_ID
- Copy the application folders to Cloud Shell:
gcloud storage cp -r gs://$PROJECT_ID/* ~/
- Make the Maven wrapper scripts executable:
chmod +x ~/guestbook-frontend/mvnw
chmod +x ~/guestbook-service/mvnw
Now you're ready to go!
Task 2. Enable Cloud Trace API
In this task, you enable the Cloud Trace API.
- In Cloud Shell, enter the following command:
gcloud services enable cloudtrace.googleapis.com
Task 3. Add the Spring Cloud GCP Trace starter
In this task, you add the Spring Cloud GCP Trace starter to the pom.xml files for the guestbook service and the guestbook frontend applications.
- Click on the
Open Editor icon and then, open ~/guestbook-service/pom.xml.
- Insert the following new dependency at the end of the dependencies section, just before the closing
</dependencies> tag:
<dependency>
<groupId>org.springframework.cloud</groupId>
<artifactId>spring-cloud-gcp-starter-trace</artifactId>
</dependency>
- In the Cloud Shell code editor, open
~/guestbook-frontend/pom.xml.
- Insert the following new dependency at the end of the dependencies section, just before the closing
</dependencies> tag:
<dependency>
<groupId>org.springframework.cloud</groupId>
<artifactId>spring-cloud-gcp-starter-trace</artifactId>
</dependency>
Task 4. Configure applications
In this task, you disable trace completely for the default profile and configure trace sampling for all requests in the cloud profile.
You get full trace capability simply by including the starters. However, only a small percentage of all requests have their traces sampled and stored by default.
Disable trace for testing purposes
For testing purposes, you disable trace in the application.properties files used for the local profile.
- In the Cloud Shell code editor, open the application properties:
guestbook-service/src/main/resources/application.properties
- Add the following property to disable tracing in the guestbook service:
spring.cloud.gcp.trace.enabled=false
- In the Cloud Shell code editor, open the following:
guestbook-frontend/src/main/resources/application.properties
- Add the following property to disable tracing in the guestbook frontend application:
spring.cloud.gcp.trace.enabled=false
Enable trace sampling for the cloud profile for the guestbook backend
For the cloud profile for the guestbook backend, you enable trace sampling for all requests in the application.properties file used for the cloud profile.
- In the Cloud Shell code editor, open the guestbook service
cloud profile:
guestbook-service/src/main/resources/application-cloud.properties
- Add the following properties to enable the tracing detail needed in the guestbook service:
spring.cloud.gcp.trace.enabled=true
spring.sleuth.sampler.probability=1.0
spring.sleuth.scheduled.enabled=false
Enable trace sampling for the cloud profile for the guestbook frontend
For the cloud profile for the frontend application, you enable trace sampling for all of the requests in the application.properties file used for the cloud profile.
- In the Cloud Shell code editor, create a properties file for the guestbook frontend application
cloud profile:
guestbook-frontend/src/main/resources/application-cloud.properties
- Add the following properties to enable the tracing detail needed in the guestbook frontend application:
spring.cloud.gcp.trace.enabled=true
spring.sleuth.sampler.probability=1.0
spring.sleuth.scheduled.enabled=false
Task 5. Set up a service account
In this task, you create a service account with permissions to propagate trace data to Cloud Trace.
- Click on the
Open Terminal icon. To create a service account specific to the guestbook application, type the following commands in Cloud Shell:
gcloud iam service-accounts create guestbook
- Add the Editor role for your project to this service account:
export PROJECT_ID=$(gcloud config list --format 'value(core.project)')
gcloud projects add-iam-policy-binding ${PROJECT_ID} \
--member serviceAccount:guestbook@${PROJECT_ID}.iam.gserviceaccount.com \
--role roles/editor
Note: This action creates a service account with the Editor role. In your production environment, you should assign only the roles and permissions that the application needs.
- Generate the JSON key file to be used by the application to identify itself using the service account:
gcloud iam service-accounts keys create \
~/service-account.json \
--iam-account guestbook@${PROJECT_ID}.iam.gserviceaccount.com
This command creates Service Account Credentials that are stored in the $HOME/service-account.json file.
Note: Treat the service-account.json file as your own username/password. Do not share this information.
Task 6. Run the application locally with your service account
In this task you start both the frontend application and backend service application using the additional spring.cloud.gcp.credentials.location property. The property specifies the location of the Service Account Credential that you created.
- Change to the
guestbook-service directory:
cd ~/guestbook-service
- Start the guestbook backend service application:
./mvnw spring-boot:run \
-Dspring-boot.run.jvmArguments="-Dspring.profiles.active=cloud \
-Dspring.cloud.gcp.credentials.location=file:///$HOME/service-account.json"
The application takes a minute or two to deploy and you should wait until you see that the GuestbookApplication is running:
Started GuestbookApplication in 20.399 seconds (JVM running...)
-
Open a new Cloud Shell tab by clicking the Add icon to the right of the title of the current Cloud Shell tab.
-
Change to the guestbook-frontend directory:
cd ~/guestbook-frontend
- Start the guestbook frontend application:
./mvnw spring-boot:run \
-Dspring-boot.run.jvmArguments="-Dspring.profiles.active=cloud \
-Dspring.cloud.gcp.credentials.location=file:///$HOME/service-account.json"
- Post a message using the Cloud Shell Web Preview of the application to generate trace data.
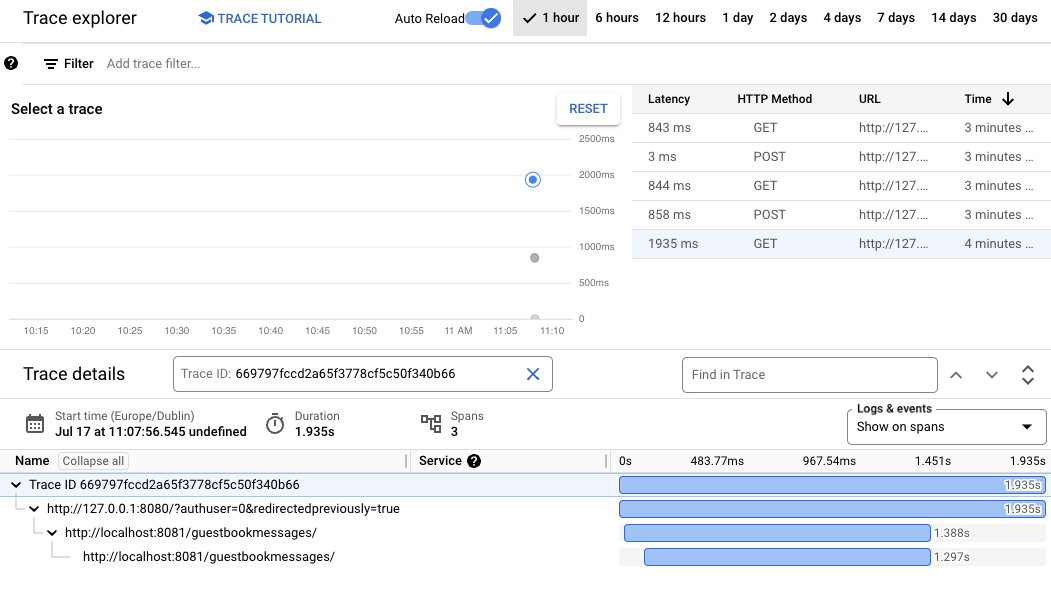
Task 7. Examine the trace
In this task you examine the trace. Spring Cloud Sleuth has generated and propagated the trace. After a few seconds it propagates to Cloud Trace.
-
Open the Google Cloud console browser tab.
-
On the Google Cloud console title bar, in the Search field, type Trace , click Search.
-
On the trace explore page, click Back to Legacy to navigate to the trace window.
-
At the top of the window, set the time range to 1 hour.
-
Turn on Auto reload. New trace data may take up to 30 seconds to appear.
-
To view trace detail, click the blue dot.
Task 8. Review
In this lab you enabled the Cloud Trace API. You used Spring to add Cloud Trace to your application. You also configured customized trace settings in an application, before finally inspecting the trace output.
End your lab
When you have completed your lab, click End Lab. Google Skills removes the resources you’ve used and cleans the account for you.
You will be given an opportunity to rate the lab experience. Select the applicable number of stars, type a comment, and then click Submit.
The number of stars indicates the following:
- 1 star = Very dissatisfied
- 2 stars = Dissatisfied
- 3 stars = Neutral
- 4 stars = Satisfied
- 5 stars = Very satisfied
You can close the dialog box if you don't want to provide feedback.
For feedback, suggestions, or corrections, please use the Support tab.
Copyright 2026 Google LLC All rights reserved. Google and the Google logo are trademarks of Google LLC. All other company and product names may be trademarks of the respective companies with which they are associated.