In this lab, you leverage Cloud Trace and Cloud Monitoring to diagnose and fix a performance issue in the running application and use Cloud Monitoring to view performance metrics of the application.
Objectives
In this lab, you learn how to perform the following tasks:
Enable, install, and configure Cloud Trace.
View Trace information to diagnose a performance issue.
Fix the performance issue and verify the performance improvement.
Monitor Google Cloud Platform products using Cloud Monitoring.
Setup and requirements
Lab setup
For each lab, you get a new Google Cloud project and set of resources for a fixed time at no cost.
Sign in to Google Skills using an incognito window.
Note the lab's access time (for example, 1:15:00), and make sure you can finish within that time.
There is no pause feature. You can restart if needed, but you have to start at the beginning.
When ready, click Start lab.
Note your lab credentials (Username and Password). You will use them to sign in to the Google Cloud Console.
Click Open Google Console.
Click Use another account and copy/paste credentials for this lab into the prompts.
If you use other credentials, you'll receive errors or incur charges.
Accept the terms and skip the recovery resource page.
Activate Google Cloud Shell
Google Cloud Shell is a virtual machine that is loaded with development tools. It offers a persistent 5GB home directory and runs on the Google Cloud.
Google Cloud Shell provides command-line access to your Google Cloud resources.
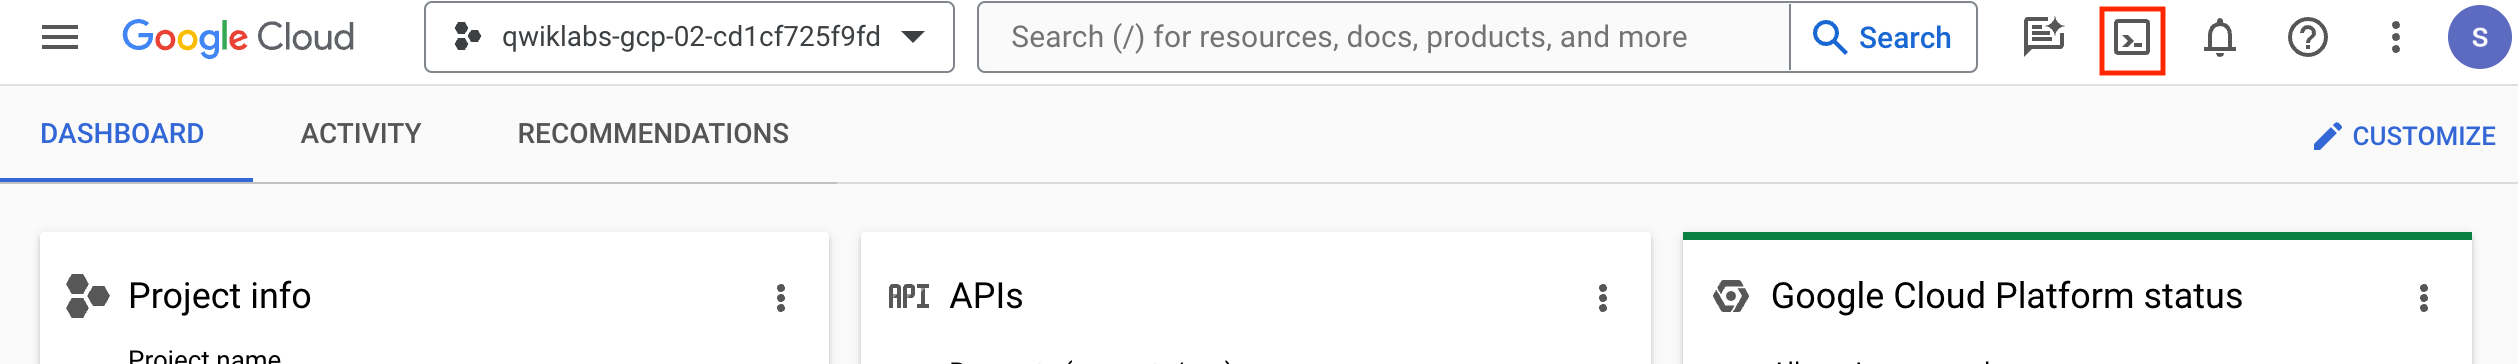
In Cloud console, on the top right toolbar, click the Open Cloud Shell button.
Click Continue.
It takes a few moments to provision and connect to the environment. When you are connected, you are already authenticated, and the project is set to your PROJECT_ID. For example:
gcloud is the command-line tool for Google Cloud. It comes pre-installed on Cloud Shell and supports tab-completion.
You can list the active account name with this command:
[core]
project = qwiklabs-gcp-44776a13dea667a6
Note:
Full documentation of gcloud is available in the
gcloud CLI overview guide
.
Task 1. Preparing the case study application
In this section, you access Cloud Shell, clone the git repository containing the quiz application, configure environment variables. and run the application.
Clone source code in Cloud Shell
To clone the repository for the class, execute the following command:
Navigate to the directory that contains the sample files for this lab:
cd ~/stackdriver-trace-monitoring/start
To replace the default region with the lab-assigned region, run the following commands:
export APP_REGION={{{project_0.startup_script.app_region | APP_REGION}}}
export REGION={{{project_0.default_region | REGION}}}
sed -i 's/us-central1/'"$REGION"'/g' prepare_environment.sh
sed -i 's/us-central/'"$APP_REGION"'/g' prepare_environment.sh
To configure the Quiz application, execute the following command:
. prepare_environment.sh
If prompted, enter Y to all unauthenticated invocations.
Note: This script file:
Creates an App Engine application.
Exports environment variables GCLOUD_PROJECT and GCLOUD_BUCKET.
Runs npm install.
Creates entities in Cloud Datastore.
Creates a Cloud Spanner instance, database, and tables.
Creates two Google Cloud Pub/Sub topics.
Creates two Cloud Functions.
Prints out the Google Cloud Platform Project ID.
Note: You may see errors for function deployment indicating that retrieving the repository metadata failed. The functions may not deploy correctly the first time because required permissions were not yet propagated.
If the functions were not successfully deployed, to try the function creation again, run the following command:
. prepare_environment.sh
Ignore any errors for the steps before the function deployments because those items have already been created. Repeat the command until both functions are successfully deployed.
To complete the preparation of the Cloud Shell environment to run the application, execute the following commands:
Create and download the key file for the service account.
Export an environment variable GOOGLE_APPLICATION_CREDENTIALS referencing the key file.
Create the necessary IAM permissions to enable the service account to access all required APIs.
In production on Compute Engine or Container Engine, you would grant access to APIs either using a custom service account or via scopes. Typically, you would allow GCP to manage key rotation.
Task 2. Harnessing Cloud Trace
In this section, you enable the Trace API, write the code to create and start the Cloud Trace in the Quiz application, and view application timings across multiple products in the Cloud Console.
Enable the Cloud Trace API
In the Cloud Console, on the Navigation menu, click APIs & services.
Click Library.
For Search for APIs & services, type Google Trace.
Click Cloud Trace API.
If the API is not enabled, click Enable.
Write code to set up Cloud Trace
Return to Cloud Shell.
To install the Node.js agent for Cloud Trace, execute the following command:
npm install @google-cloud/trace-agent
In Cloud Shell, click Open Editor to open in a new window.
Navigate to stackdriver-trace-monitoring/start.
Open ...frontend/app.js.
Note: Update code within the sections marked as follows:
// TODO // END TODO
To maximize your learning, review the code, inline comments, and related API documentation.
At the top of the app.js file, load the '@google-cloud/trace-agent' module and then start() it:
frontend/app.js
// TODO: Load the trace-agent and start it
// Trace must be started before any other code in the
// application.
require('@google-cloud/trace-agent').start({
projectId: config.get('GCLOUD_PROJECT')
});
// END TODO
Save the file.
Run the web application and view trace data
To start the application, execute the following command:
npm start
In Cloud Shell, click Web preview > Preview on port 8080 to preview the quiz application.
Return to the Cloud Platform Console.
On the Navigation menu, click View all Products. Under Observability, click Trace.
Note: The Trace overview page opens.
However, it may take a few minutes for the first request to populate.
After this happens, trace data is visible with just a few seconds' latency.
Return to the Trace Explorer window in the Cloud Platform Console and enable Auto Refresh.
While waiting for the first Trace to populate, return to the Cloud Shell window and look for error messages.
Note: Sometimes, due to a timing issue after enabling APIs, you might see errors about Cloud Trace.
If you see errors, stop the Quiz application, restart after a minute, and then refresh the Quiz application home page.
Return to Trace Explorer in the Cloud Platform Console.
After your first Trace has populated, click the GET / entry.
Note: You should see the Latency, HTTP Method, and URL for the request.
Return to the quiz application and click Create Question.
Fill in the form using the following values:
Form Field
Value
Author
Your Name
Quiz
Google Cloud Platform
Title
Which Google Cloud product allows you to see request timing?
Answer 1
Debugger
Answer 2
Error Reporting
Answer 3
Logging
Answer 4
Trace (select the Answer 4 radio button)
Click Save.
Note: Look at the Trace list.
Eventually, two new requests are displayed:
GET /questions/add
POST /questions/add
Click on the POST request against the /questions/add URL.
Note: You should see the total time to handle the request and the call made against the Cloud Datastore.
Return to the quiz application, and click Take Test.
Click People.
Complete the test, and submit feedback.
Return to the Trace Explorer window in the Cloud Console.
Note: Look at the Trace list again. Eventually a set of new requests is displayed.
Find the following requests and click on them:
POST /api/quizzes/people
POST /api/quizzes/feedback/people
These represent the calls made from the client-side application against the quiz application.
Once again, you should see the total time taken to complete the request.
Notice that the calls are sequential. This is because the Cloud Pub/Sub request needs the correct answers from Question entities in Cloud Datastore to send answer data to Cloud Pub/Sub for Storage in Cloud Spanner.
In the quiz application, click Quite Interesting Quiz in the toolbar, and then click Leaderboard.
Return to the Trace Explorer window in the Cloud Console and review the Trace data for the new request.
Note: You should see that this request includes calls to Cloud Spanner.
Task 3. Diagnosing a performance problem with Cloud Trace
In this section, you continue to explore the quiz application with Trace Explorer and identify and resolve a performance issue.
Identify a performance problem with Cloud Trace
Return to the quiz application and click Take Test.
Click Places.
Complete the test, and submit feedback.
Return to the Trace Explorer window in the Cloud Console.
Note: Look at the Trace list again. Eventually a set of new requests will be displayed.
Find the following requests and click on them:
POST /api/quizzes/places
POST /api/quizzes/feedback/places
These represent the calls made from the client-side application against the quiz application.
Once again, you should see the total time taken to complete the request.
Notice that the calls are sequential. This is because the Cloud Pub/Sub request needs data from Cloud Datastore to send the answer data to Cloud Pub/Sub.
Note: However, you should also see that each call to Cloud Pub/Sub is also sequential; this is not OK!
Return to the quiz application and click GCP.
Complete the test, and submit feedback.
Return to the Trace Explorer window in the Cloud Console.
Note: Look at the Trace list once again. Eventually a set of new requests will be displayed.
Find the following requests and click on them:
POST /api/quizzes/gcp
POST /api/quizzes/feedback/gcp
These represent the calls made from the client-side application against the quiz application.
Once again, you should see the total time taken to complete the request.
Notice that the calls are sequential. This is because the Cloud Pub/Sub request needed data from Cloud Datastore to send the answer data to Cloud Pub/Sub.
Note: However, you should also see that once again, each call to Cloud Pub/Sub is also sequential.
With four questions in the quiz, it's taking four times as long to send the Cloud Pub/Sub messages!
This is definitely not OK!
Modify application code to resolve the performance problem
Return to the Cloud Shell and launch the Code editor if it is not opened already.
Navigate to stackdriver-trace-monitoring/start/.
Open ...frontend/api/index.js.
Find the statement that publishes answer messages in sequence, and modify it to perform the operations in parallel.
Note: Fortunately, this is a very easy change to make! The code change is shown below.
api/index.js before the change:
// TODO: Sends the answers to Pub/Sub in parallel
// Sends the answers to Pub/Sub in sequence
// Change sequence to parallel in the next statement
sequence(answersWithCorrect.map(answer => () => publisher.publishAnswer(answer))).then(() => {
// Waits until all the Pub/Sub messages have been acknowledged before returning to the client
const score = answersWithCorrect.filter(a => a.answer == a.correct).length;
res.status(200).json({ correct: score, total: questions.length });
});
// END TODO
api/index.js after the change:
// TODO: Sends the answers to Pub/Sub in parallel
// Changed to parallel
parallel(answersWithCorrect.map(answer => () => publisher.publishAnswer(answer))).then(() => {
// Waits until all the Pub/Sub messages have been acknowledged before returning to the client
const score = answersWithCorrect.filter(a => a.answer == a.correct).length;
res.status(200).json({ correct: score, total: questions.length });
});
// END TODO
Confirm problem resolution with Cloud Trace
Return to the Cloud Shell, stop the application by pressing Ctrl+C, and then start it again.
Return to the Quiz application, and take the People, Places, and GCP tests again.
Return to the Trace Explorer window in the Cloud Console.
Note: Look at the Trace list once again. Eventually a set of new requests will be displayed.
Find the following requests and click on them:
POST /api/quizzes/people|places|gcp
POST /api/quizzes/feedback/people|places|gcp
These represent the calls made from the client-side application against the quiz application.
Once again, you should see the total time taken to complete the request.
Note: This time, you should see that all of the Pub/Sub messages have been dispatched in parallel.
The time taken to complete processing of the requests is significantly lower.
Task 4. Visualizing application metrics with Cloud Monitoring
In this section, you continue to explore the quiz application with Cloud Monitoring by exploring metrics and create dashboards.
Create a Monitoring workspace
You will now setup a Monitoring workspace that's tied to your Google Cloud Project. The following steps create a new account that has a free trial of Monitoring.
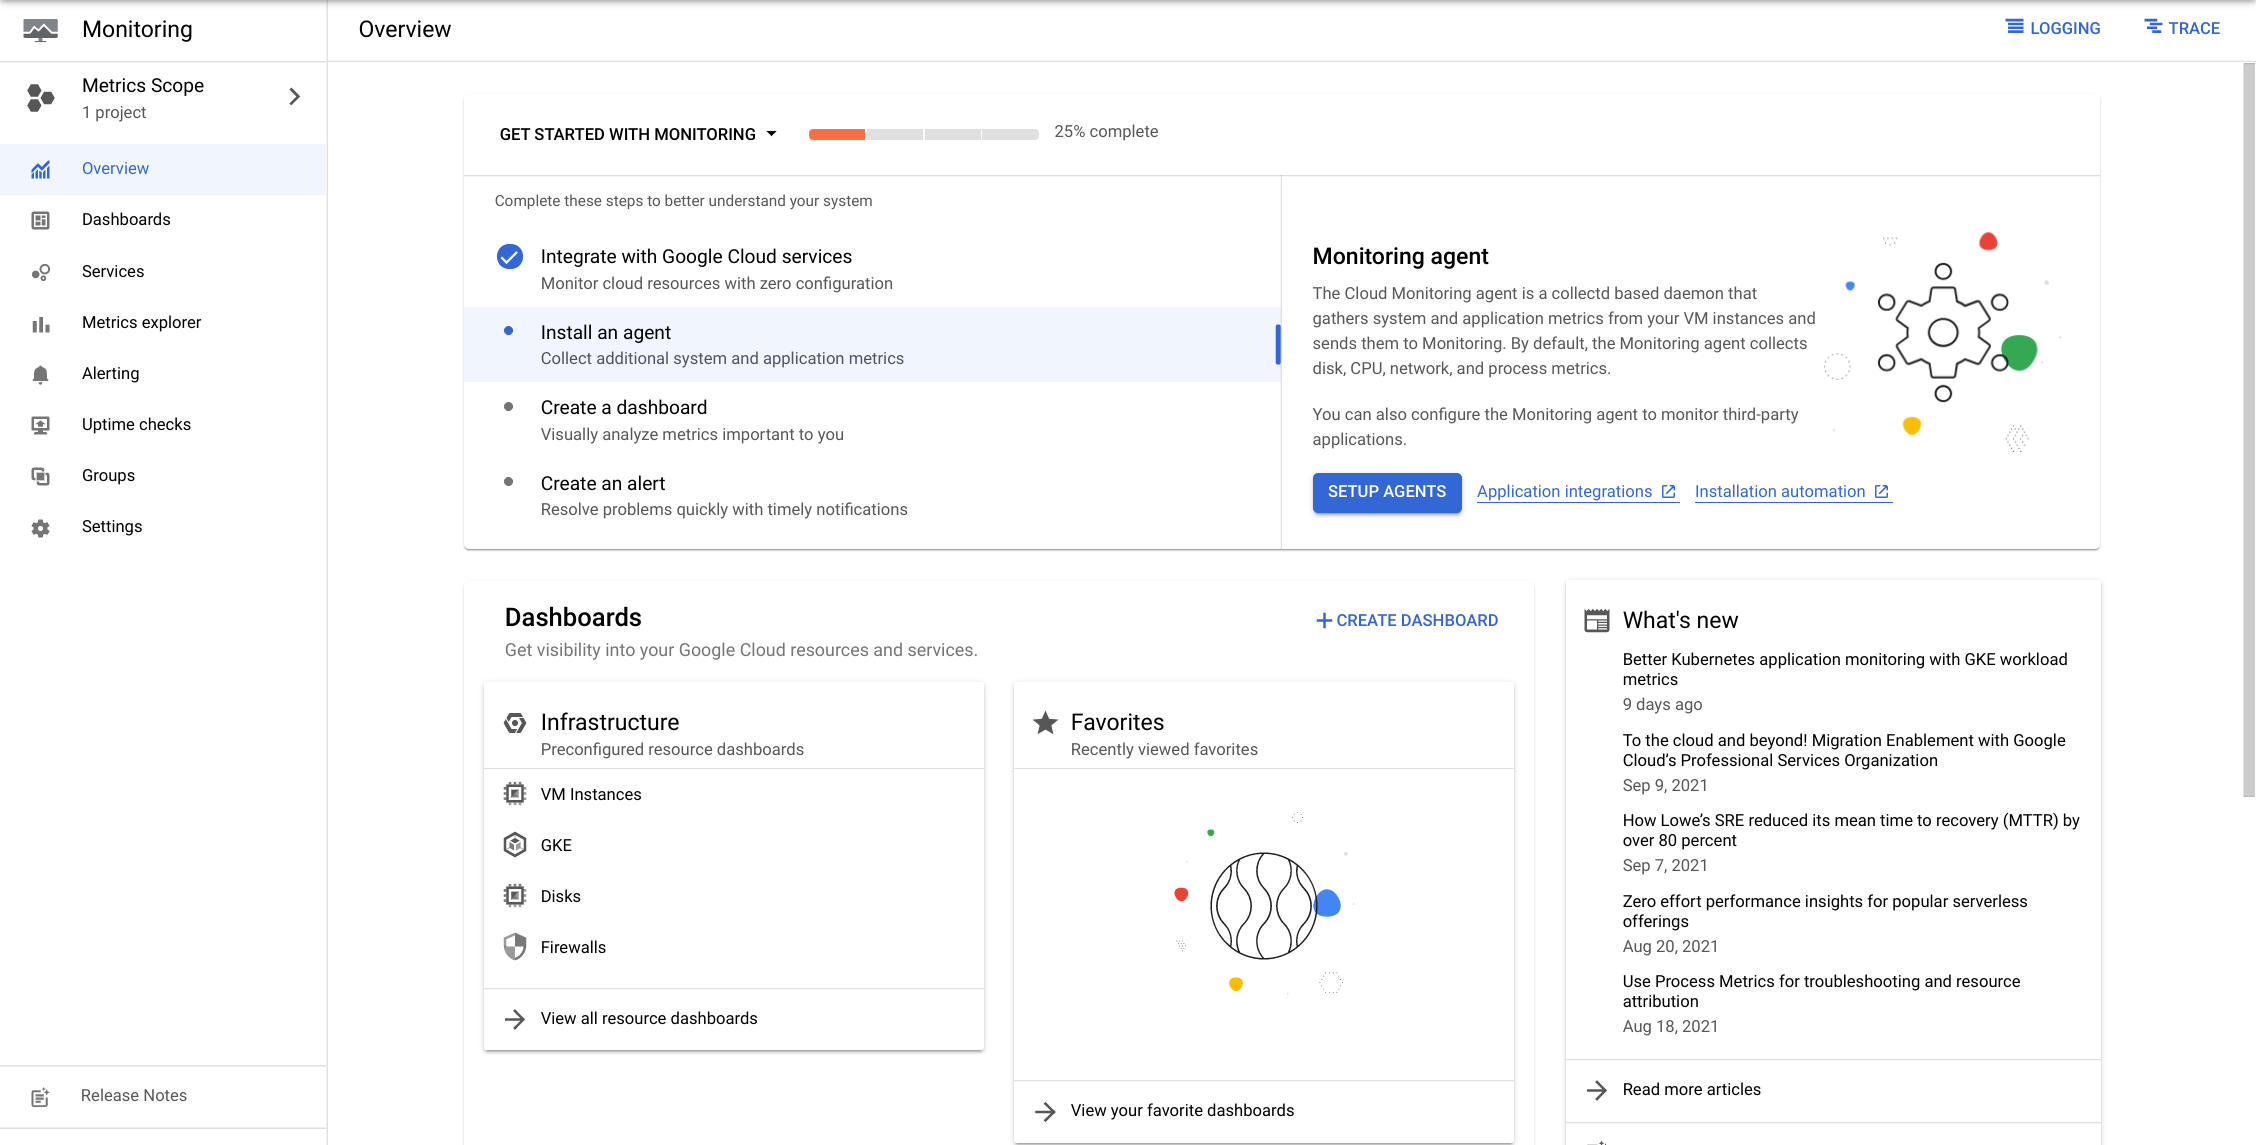
In the Cloud Console, click on Navigation menu > Monitoring.
Wait for your workspace to be provisioned.
When the Monitoring dashboard opens, your workspace is ready.
Create a dashboard and explore metrics
In the left-hand pane, click Dashboards.
Click Create Custom Dashboard.
For New Dashboard Name, type Quiz Application Metrics.
Click +Add Widget.
For Visualization, select Line chart.
For the Metric field, click on Select a metric, then select Cloud Spanner Instance > Instance > CPU Utilization dropdown, and then click Apply.
Select only Active resources.
Note: Examples of resources that are active:
cloud_function
datastore_request
gcs_bucket
global
pubsub_subscription
pubsub_topic
spanner_instance
Click on each resource in turn, and select a few metrics that are of interest to you.
Note: Here are some example metrics to explore:
cloudfunctions/function/execution_count
datastore/api/request_count
storage/api/request_count
logging/log_entry_count
pubsub/subscription/num_outstanding_messages
pubsub/topic/message_sizes
spanner/api/request_count
Create several charts, including your own selection of resource and metrics.
Note: Review
Which Google Cloud product should be loaded first, before any other code?
Cloud Trace
Cloud Debugger
Cloud Error Reporting
Cloud Logging
Which GCP products are integrated into Google Cloud Trace?
Cloud Datastore
Cloud Spanner
Cloud Pub/Sub
Cloud Storage
With Cloud Monitoring, which feature allows charts to be assembled to view performance of your application?
Alerting
Uptime Checks
Dashboards
Groups
Task 5. Bonus: Deploy the Quiz Application into Container or App Engine
Use the notes from the appropriate labs to do this. After the application is deployed, you'll be able to monitor both the frontend and the Google Cloud resources.
End your lab
When you have completed your lab, click End Lab. Google Skills removes the resources you’ve used and cleans the account for you.
You will be given an opportunity to rate the lab experience. Select the applicable number of stars, type a comment, and then click Submit.
The number of stars indicates the following:
1 star = Very dissatisfied
2 stars = Dissatisfied
3 stars = Neutral
4 stars = Satisfied
5 stars = Very satisfied
You can close the dialog box if you don't want to provide feedback.
For feedback, suggestions, or corrections, please use the Support tab.
Copyright 2026 Google LLC All rights reserved. Google and the Google logo are trademarks of Google LLC. All other company and product names may be trademarks of the respective companies with which they are associated.
시작하기 전에
실습에서는 정해진 기간 동안 Google Cloud 프로젝트와 리소스를 만듭니다.
실습에는 시간 제한이 있으며 일시중지 기능이 없습니다. 실습을 종료하면 처음부터 다시 시작해야 합니다.
화면 왼쪽 상단에서 실습 시작을 클릭하여 시작합니다.
시크릿 브라우징 사용
실습에 입력한 사용자 이름과 비밀번호를 복사합니다.
비공개 모드에서 콘솔 열기를 클릭합니다.
콘솔에 로그인
실습 사용자 인증 정보를 사용하여
로그인합니다. 다른 사용자 인증 정보를 사용하면 오류가 발생하거나 요금이 부과될 수 있습니다.
약관에 동의하고 리소스 복구 페이지를 건너뜁니다.
실습을 완료했거나 다시 시작하려고 하는 경우가 아니면 실습 종료를 클릭하지 마세요. 이 버튼을 클릭하면 작업 내용이 지워지고 프로젝트가 삭제됩니다.
현재 이 콘텐츠를 이용할 수 없습니다
이용할 수 있게 되면 이메일로 알려드리겠습니다.
감사합니다
이용할 수 있게 되면 이메일로 알려드리겠습니다.
한 번에 실습 1개만 가능
모든 기존 실습을 종료하고 이 실습을 시작할지 확인하세요.
시크릿 브라우징을 사용하여 실습 실행하기
이 실습을 실행하는 가장 좋은 방법은 시크릿 모드 또는 시크릿 브라우저 창을 사용하는 것입니다. 개인 계정과 학생 계정 간의 충돌로 개인 계정에 추가 요금이 발생하는 일을 방지해 줍니다.
In this lab, you will leverage Cloud Trace and Monitoring to diagnose and fix a performance issue in the running application and Cloud Monitoring to view performance metrics of the application.