


시작하기 전에
- 실습에서는 정해진 기간 동안 Google Cloud 프로젝트와 리소스를 만듭니다.
- 실습에는 시간 제한이 있으며 일시중지 기능이 없습니다. 실습을 종료하면 처음부터 다시 시작해야 합니다.
- 화면 왼쪽 상단에서 실습 시작을 클릭하여 시작합니다.
Configure the export to BigQuery
/ 50
Create a logging metric
/ 50

In this lab, you will learn common configurations and uses of both Cloud Logging and Cloud Monitoring.
You will learn how to view logs with filtering mechanisms, export logs to BigQuery syncs, and create logging metrics. You will also learn how to use Cloud Monitoring to view consumption metrics and create dashboards..
In this lab, you will learn how to perform the following tasks:
For each lab, you get a new Google Cloud project and set of resources for a fixed time at no cost.
Sign in to Google Skills using an incognito window.
Note the lab's access time (for example, 1:15:00), and make sure you can finish within that time.
There is no pause feature. You can restart if needed, but you have to start at the beginning.
When ready, click Start lab.
Note your lab credentials (Username and Password). You will use them to sign in to the Google Cloud Console.
Click Open Google Console.
Click Use another account and copy/paste credentials for this lab into the prompts. If you use other credentials, you'll receive errors or incur charges.
Accept the terms and skip the recovery resource page.
Google Cloud Shell is a virtual machine that is loaded with development tools. It offers a persistent 5GB home directory and runs on the Google Cloud.
Google Cloud Shell provides command-line access to your Google Cloud resources.
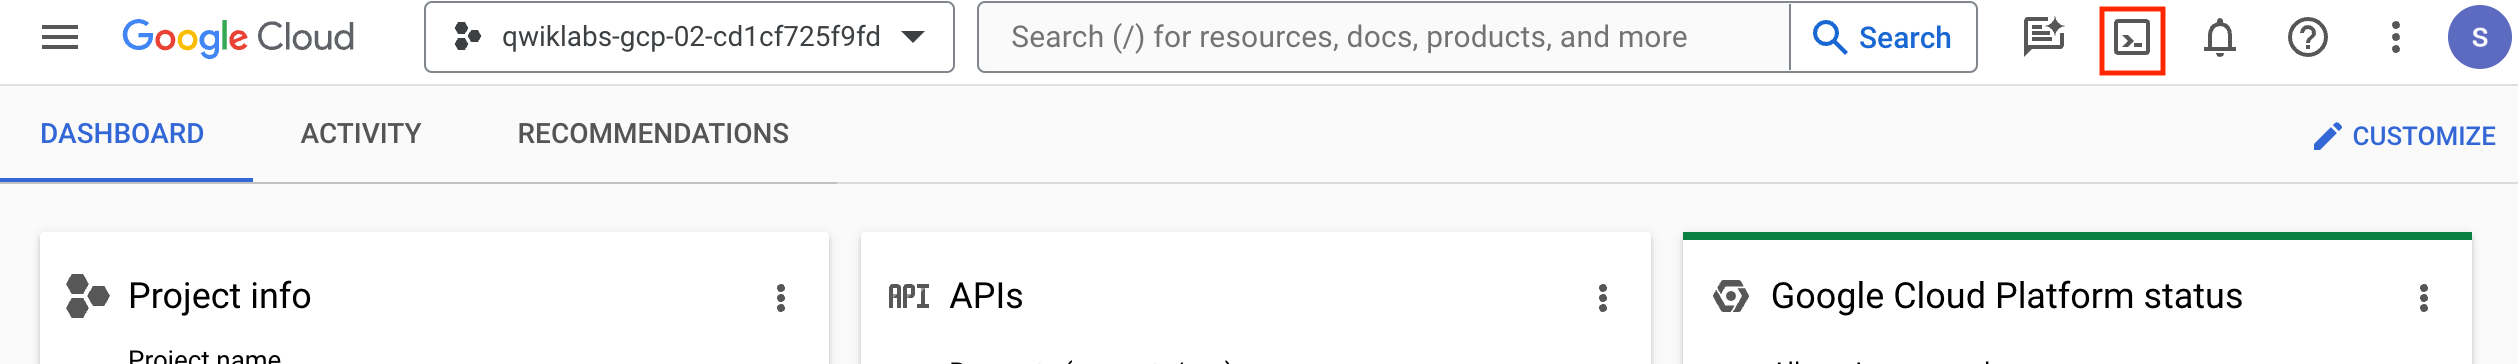
In Cloud console, on the top right toolbar, click the Open Cloud Shell button.
Click Continue.
It takes a few moments to provision and connect to the environment. When you are connected, you are already authenticated, and the project is set to your PROJECT_ID. For example:
gcloud is the command-line tool for Google Cloud. It comes pre-installed on Cloud Shell and supports tab-completion.
Output:
Example output:
Output:
Example output:
In this task, you view VM instance logs with simple filtering.
Ensure that you are on the Google Cloud Console homepage.
Verify you are still working in project 1; the project ID in the Console's info panel should match Project ID 1 in your lab's connection details panel.
In the Google Cloud console, in the Navigation menu (
If prompted, close the notification.
All of these services are writing log entries. Entries from all these logs appear on the right, in the Query results pane. You can also query for results from specific logs, or that match specific criteria.
After you click this:
INSTANCE ID. It shows all the instance IDs of the VM instances that are writing log entries.resource.type="gce_instance". This means that only entries from VM instances will be logged and displayed.In the Instance Id field, select one of the instance IDs. Logs for the associated VM instance appear in the Query results pane.
Click inside the Query box. This now becomes editable.
In the Query box, remove everything after line 1. You should see only line 1, which contains resource.type="gce_instance".
Click Run query (located in the top-right corner). In the Query results, you should see entries from all VM instance logs.
Note that the logs panel reverts to its previous state.
Entries from syslog appear in the Query results pane.
 ) Stream logs (top-right corner, above the "Run query" button).
The streamed logs are visible in the results pane.
In this task, you configure and test log exports to BigQuery.
Cloud Logging retains log entries for 30 days. In most circumstances, you'll want to retain some log entries for an extended time (and possibly perform sophisticated reporting on the archived logs).
Google Cloud provides a mechanism to have all log entries ingested into Cloud Monitoring also written to one or more archival sinks.
In the Google Cloud console, in the Navigation menu (
Click Create sink.
For the Sink name, type vm_logs and then click Next.
For Select sink service, select BigQuery dataset.
For Select BigQuery dataset, select Create new BigQuery dataset.
For the Dataset ID, type project_logs, and click Create dataset.
Click Next.
In the Build inclusion filter list box, copy and paste resource.type="gce_instance"
Click Next.
Click Create sink. You will now return to a Log Router Create log sink next steps page (a message at the top may appear that says "Your log sink was successfully created. Data should be available soon.")
Monitoring > Pub/Sub > Dataflow > BigQuery/Bigtable).
Exporting to Cloud Storage will batch up entries and write them into Cloud Storage objects approximately every hour.You will now create an export for the HTTP load balancing logs to BigQuery.
From the left-hand navigation menu, select Log router to return to the service homepage.
Click Create Sink.
For the Sink name, type load_bal_logs and then click Next.
For Select sink service, select BigQuery dataset.
For Select BigQuery dataset, select project_logs. (You created this BigQuery dataset in the previous set of steps.)
Click Next.
In the Build inclusion filter list box, copy and paste resource.type="http_load_balancer"
Click Next.
Click Create sink.
You will now be on the Create log sink next steps page for the log sink.
From the left-hand navigation menu, select Log router to return to the service homepage.
The Log Router page appears, displaying a list of sinks (including the one you just created—load_bal_logs).
In the Google Cloud console, on the Navigation menu (
The "Welcome to BigQuery in the Cloud Console" message box opens. This message box provides a link to the quickstart guide and lists UI updates.
Click Done.
In the left pane in the Explorer section, click the arrow next to your project (this starts with qwiklabs-gcp-xxx) and you should see a project_logs dataset revealed under it.
You will now verify that the BigQuery dataset has appropriate permissions to allow the export writer to store log entries.
Click on the three dotted menu item ("View actions") next to the project_logs dataset and click Open.
Then from the top-right hand corner of the console, click the Share dropdown and select Manage permissions.
On the Share permissions page, you will see that your service accounts have the "BigQuery Data Editor" role.
Close the share permissions panel.
Expand the project_logs dataset to see the tables with your exported logs—you should see multiple tables (one for each type of log that's receiving entries).
Click on the syslog_(1) table, then click Details to see the number of rows and other metadata.
qwiklabs-gcp-xx.project_logs.syslog_xxxxx with the table name you copied in the previous step).Feel free to experiment with some other queries that might provide interesting insights.
Note: Cloud Logging exports incoming log entries before any decision is made about ingesting the entry into logging storage. As a result, only new log entries will be exported to the sink. As a result, you may not see a syslog_(1) table as all the syslog entries were generated prior to the export.
gcloud logging read "resource.type=gce_instance AND logName=projects/[PROJECT_ID]/logs/syslog AND textPayload:SyncAddress" --limit 10 --format json.
Click Check my progress to verify the objective.
In this task, you create a counter-type logging metric named 403s within Google Cloud Monitoring. You configure this metric to filter and count syslog entries specifically from your GCE instances.
), click Monitoring > Logs-based Metrics.Click Create metric.
In the Log-based metric Editor, set Metric Type as Counter.
For the Details section, set the Log-based metric name to 403s.
For the Filter selection for Build filter, enter the following and replace PROJECT_ID with Project ID 1:
Leave all the other fields at their default.
Click Create metric.
You will make use of this metric in the dashboarding portion of the lab.
Click Check my progress to verify the objective.
In this task, you switch to the second project created by Google Skills and setup a Monitoring workspace.
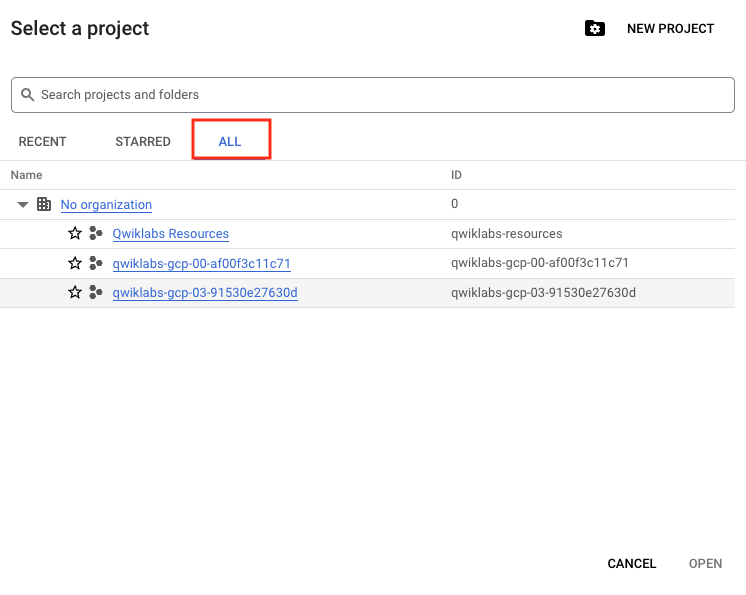
Note the Project shown in the upper left corner of the Google Cloud console. First, you’ll switch the console to use Project ID 2.
Click the project that matches Project ID 2 from the Google Skills Connection Details.
Click Open.
You will now setup a Monitoring workspace that's tied to your Google Cloud Project. The following steps create a new account that has a free trial of Monitoring.
In the Google Cloud console, in the Navigation menu (
Wait for your workspace to be provisioned.
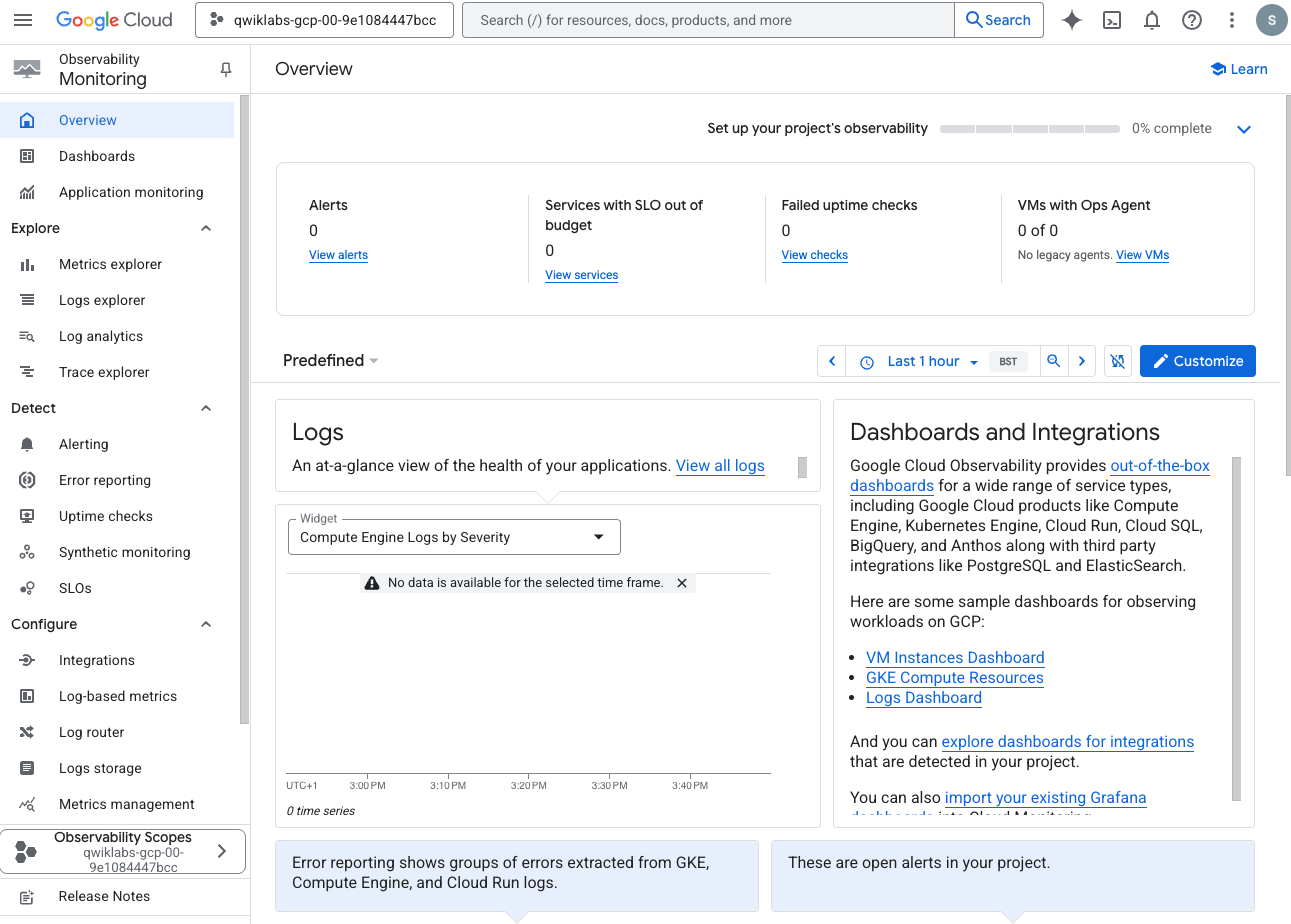
When the Monitoring dashboard opens, your workspace is ready.
Now add the first project to your Cloud Monitoring workspace.
In the left menu, click Settings, then click Metric Scope and click + Add projects.
Click Select Projects
Select the checkmark next to your first project ID and click Select.
Click Add projects.
In the left pane, click Dashboards.
Click Create Custom Dashboard.
Replace the generic dashboard name at the top with Example Dashboard.
Click + Add widget > Line.
For Widget Title, enter in CPU Usage.
Click Select a metric dropdown.
Click Active to deselect it. The tick should disappear.
From Popular Resources, select VM Instance > Instance > CPU usage. Make sure it's the one that follows the format: compute.googleapis.com/instance/cpu/usage_time.
Click Apply.
Now click Apply in the top-right corner.
Click + Add widget > Line.
For Widget Title, enter in Memory Utilization.
Click Select a metric dropdown.
Click Active to deselect it. The tick should disappear.
From Popular Resources, select VM Instance > Memory > Memory utilization. Make sure it's the one that follows the format: agent.googleapis.com/memory/percent_used.
Click Apply.
Now click Apply in the top-right corner.
Click + Add widget > Line.
For Widget Title, enter in 403s.
Click Select a metric dropdown.
From Popular Resources, select VM Instance > Logs-based metrics > Logging/user/403s. Make sure it's the one that follows the format: logging.googleapis.com/user/403s.
Click Apply.
Now click Apply in the top-right corner.
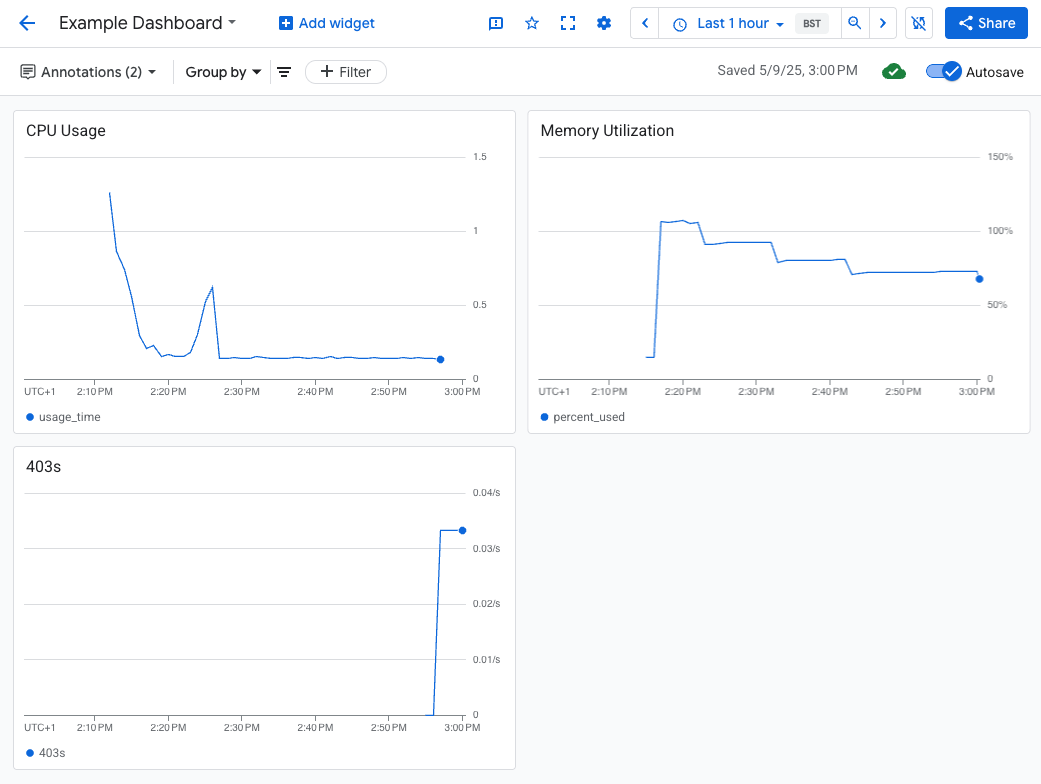
You should now see your three graphs—one for CPU usage, memory utilization—populated and the other for 403s .
You can now explore some other options by editing the charts such as Filter, Group By, and Aggregation.
In this lab, you learned how to do the following:
View logs using a variety of filtering mechanisms.
Exclude log entries and disable log ingestion.
Export logs and run reports against exported logs.
Create and report on logging metrics.
Use Cloud Monitoring to monitor different Google Cloud projects.
Create a metrics dashboard.
When you have completed your lab, click End Lab. Google Skills removes the resources you’ve used and cleans the account for you.
You will be given an opportunity to rate the lab experience. Select the applicable number of stars, type a comment, and then click Submit.
The number of stars indicates the following:
You can close the dialog box if you don't want to provide feedback.
For feedback, suggestions, or corrections, please use the Support tab.
Copyright 2026 Google LLC All rights reserved. Google and the Google logo are trademarks of Google LLC. All other company and product names may be trademarks of the respective companies with which they are associated.


현재 이 콘텐츠를 이용할 수 없습니다
이용할 수 있게 되면 이메일로 알려드리겠습니다.

감사합니다
이용할 수 있게 되면 이메일로 알려드리겠습니다.

한 번에 실습 1개만 가능
모든 기존 실습을 종료하고 이 실습을 시작할지 확인하세요.