

Before you begin
- Labs create a Google Cloud project and resources for a fixed time
- Labs have a time limit and no pause feature. If you end the lab, you'll have to restart from the beginning.
- On the top left of your screen, click Start lab to begin
As a security analyst, you’ll need to analyze network traffic in order to learn what type of traffic is being sent to and from systems on the networks you’ll be working with.
Previously, you learned about packet capture and analysis. Analyzing packets can help security teams interpret and understand network communications. Network protocol analyzers such as Wireshark, which has a graphical user interface or GUI, can help you examine packet data during your investigations. Since network packet data is complex, network protocol analyzers (packet sniffers) like Wireshark are designed to help you find patterns and filter the data in order to focus on the network traffic that is most relevant to your security investigations.
Now you’ll use Wireshark to inspect packet data and apply filters to sort through packet information efficiently.
In this lab activity, you’ll use Wireshark to examine a sample packet capture file and filter the network traffic data.
In this scenario, you’re a security analyst investigating traffic to a website.
You’ll analyze a network packet capture file that contains traffic data related to a user connecting to an internet site. The ability to filter network traffic using packet sniffers to gather relevant information is an essential skill as a security analyst.
You must filter the data in order to:
Here’s how you’ll do this: First, you’ll open the packet capture file and explore the basic Wireshark graphic user interface. Second, you’ll open a detailed view of a single packet and explore how to examine the various protocol and data layers inside a network packet. Third, you’ll apply filters to select and inspect packets based on specific criteria. Fourth, you’ll filter and inspect UDP DNS traffic to examine protocol data. Finally, you’ll apply filters to TCP packet data to search for specific payload text data.
You’re ready to use Wireshark to inspect network packet data!
You'll need to start the lab before you can access the materials. To do this, click the green "Start Lab" button at the top of the screen.
After you click the "Start Lab" button, you will see a panel appear below where the start lab button was that has an Open Windows VM button.
Click the Open Windows VM button and a new tab will open with a visual interface for Windows OS, where you will be performing further steps in the lab.
Note: As the virtual machine loads, a pop up will appear in the top left corner of the VM requesting permission to access the clipboard. Please select “Allow” to enable you to copy and paste the commands.
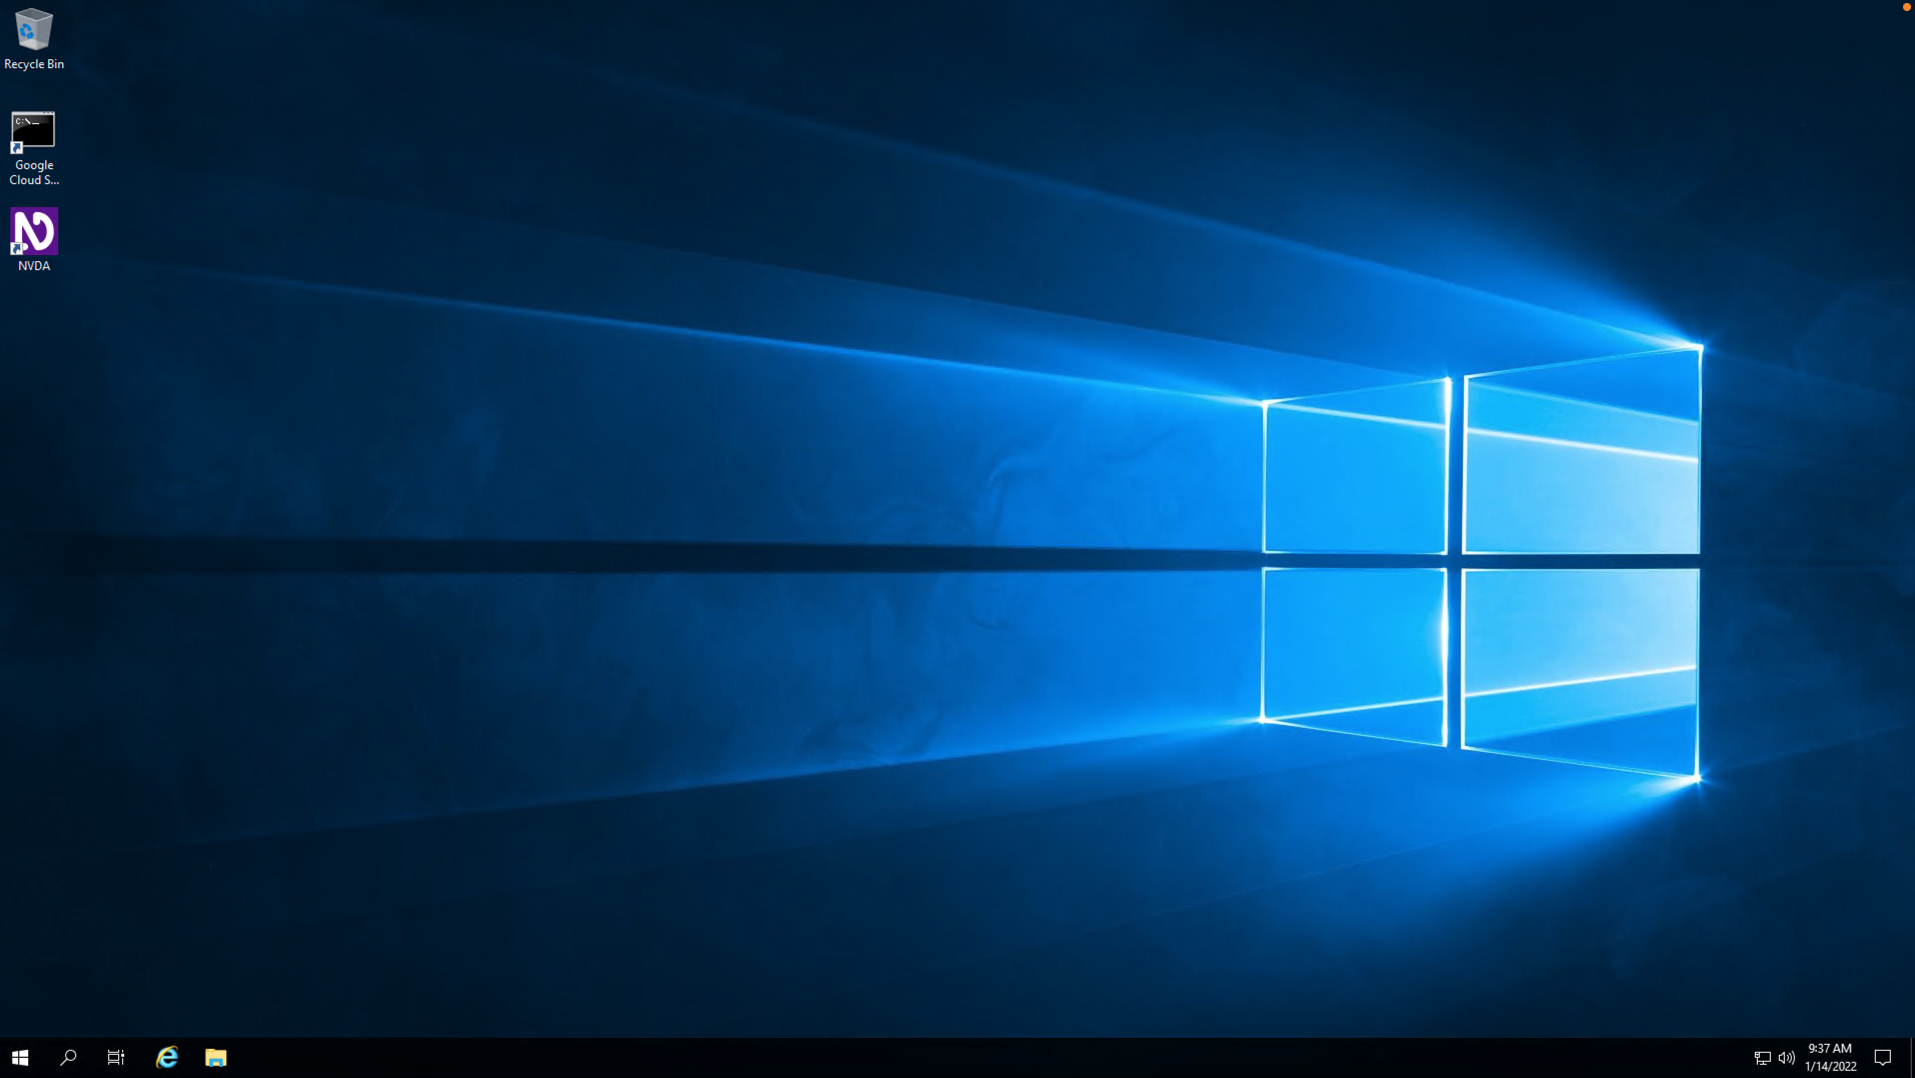
You should have a visual interface for Windows that looks like this:
Note: If the Windows VM becomes stuck and disconnects automatically, you can reconnect in the following ways:
| Server | localhost |
| Username | qwiklabs |
| Password |
In this task, you must open a network packet capture file that contains data captured from a system that made web requests to a site. You need to open this data with Wireshark to get an overview of how the data is presented in the application.
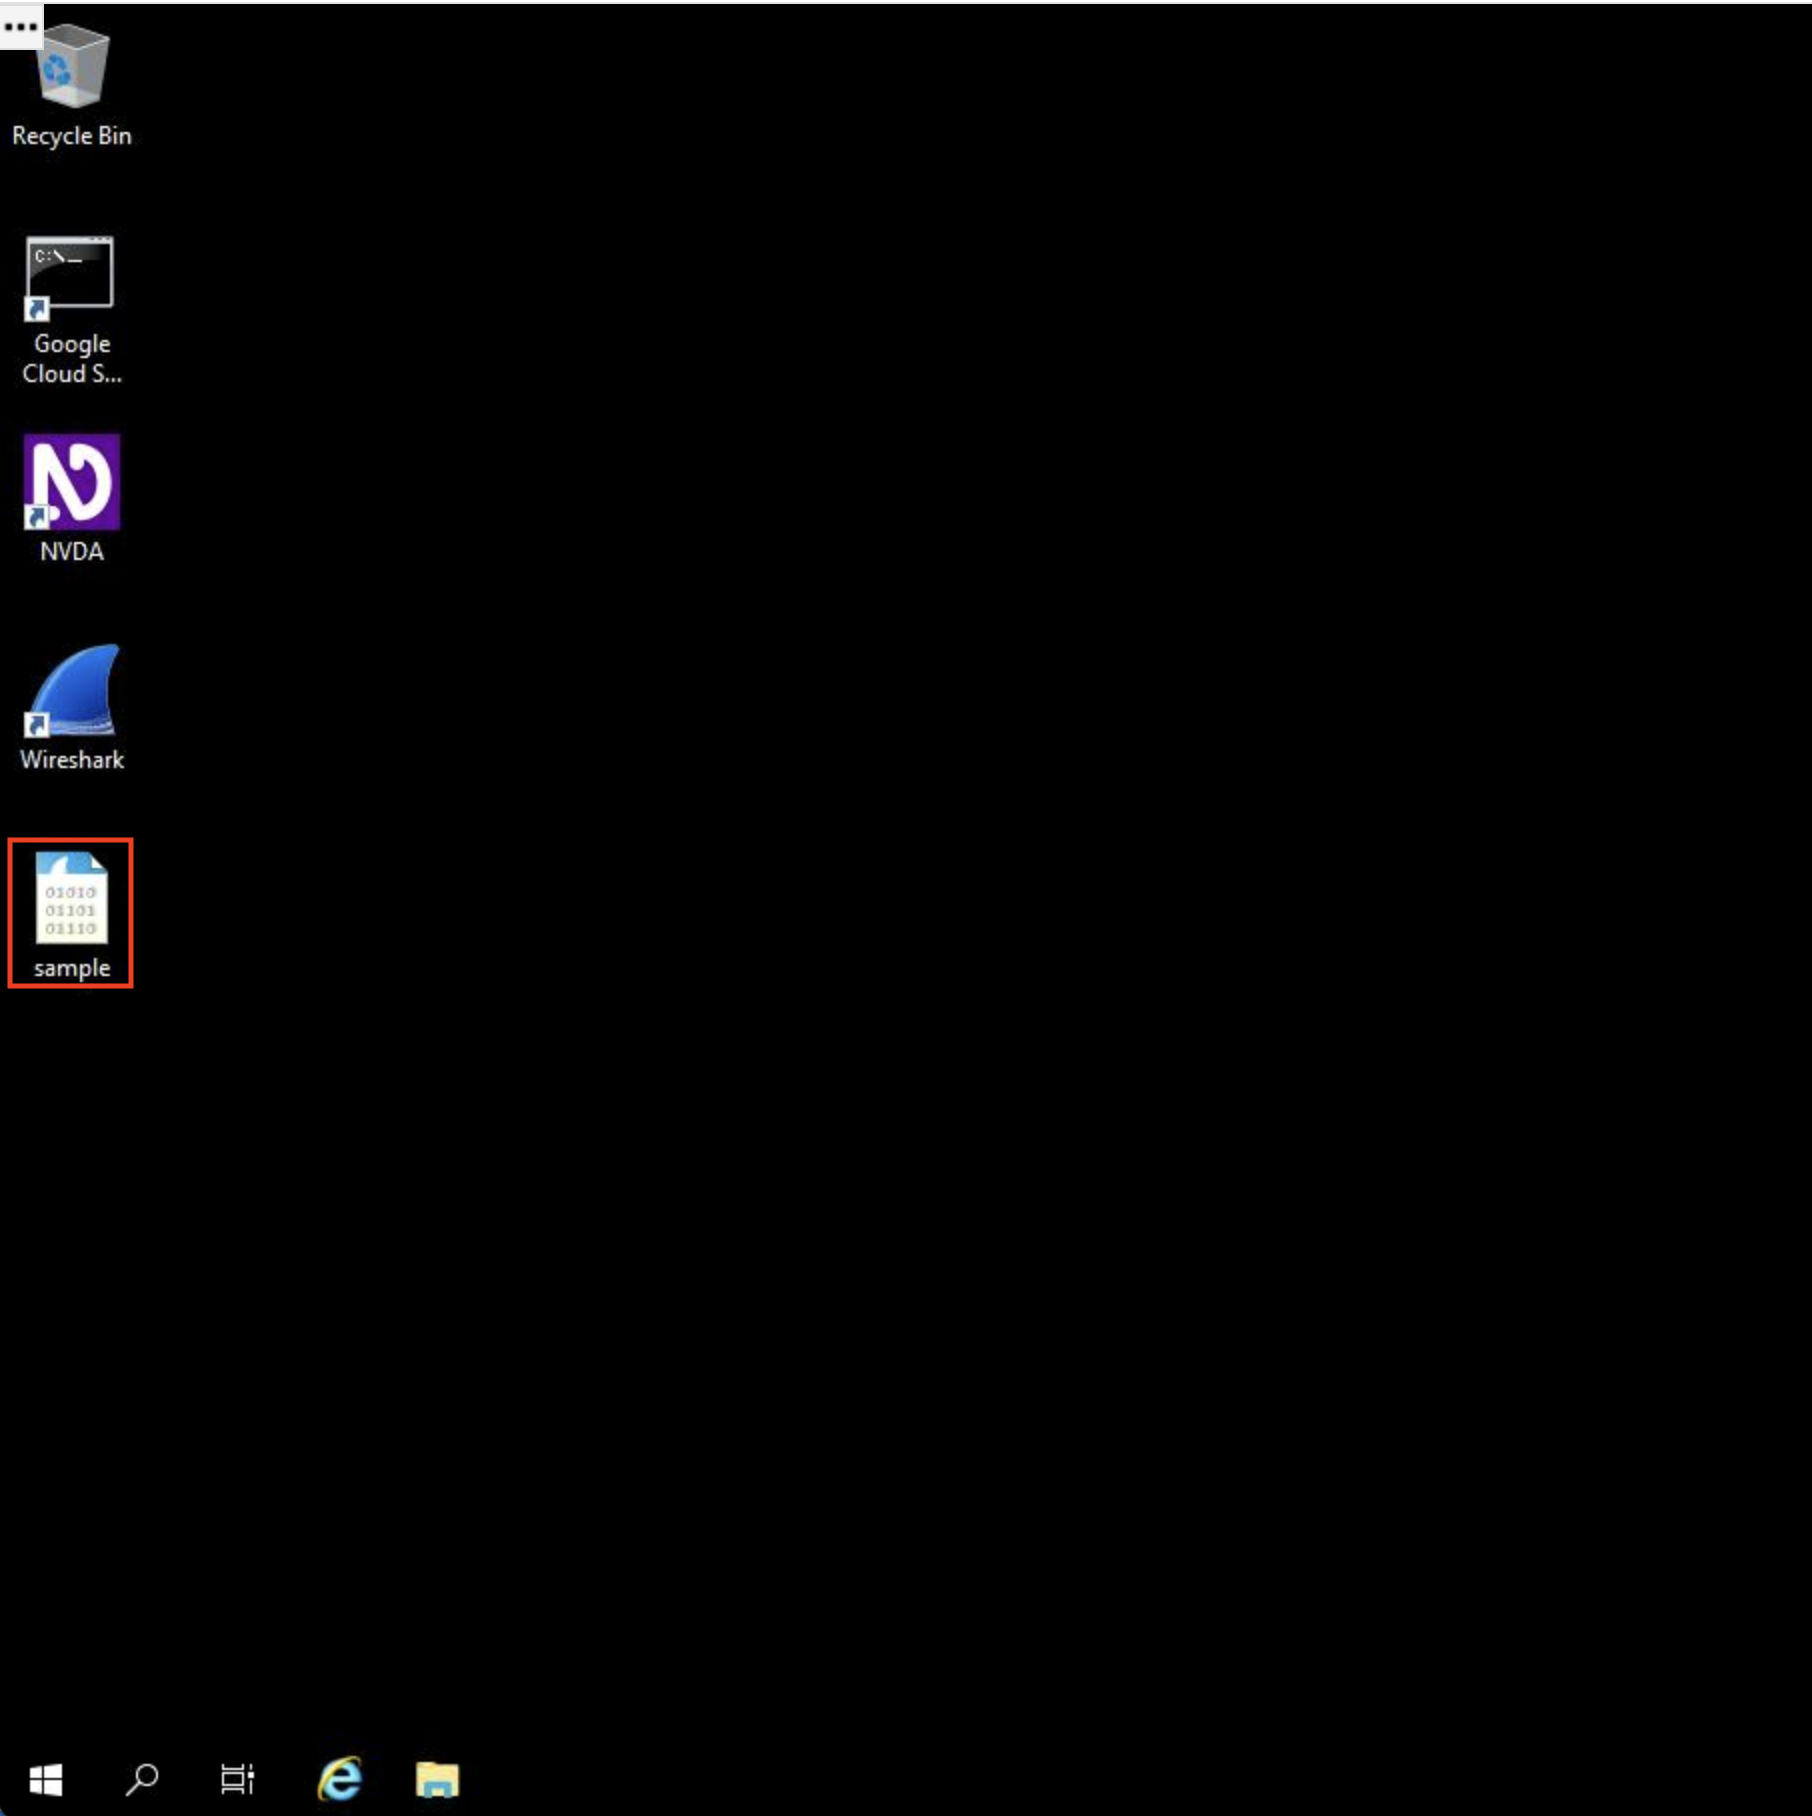
The packet capture file has the Wireshark packet capture file icon, which shows a shark's fin swimming above three rows of binary digits. The packet capture file has a .pcap file extension that is hidden by default by Windows Explorer and on the desktop view.
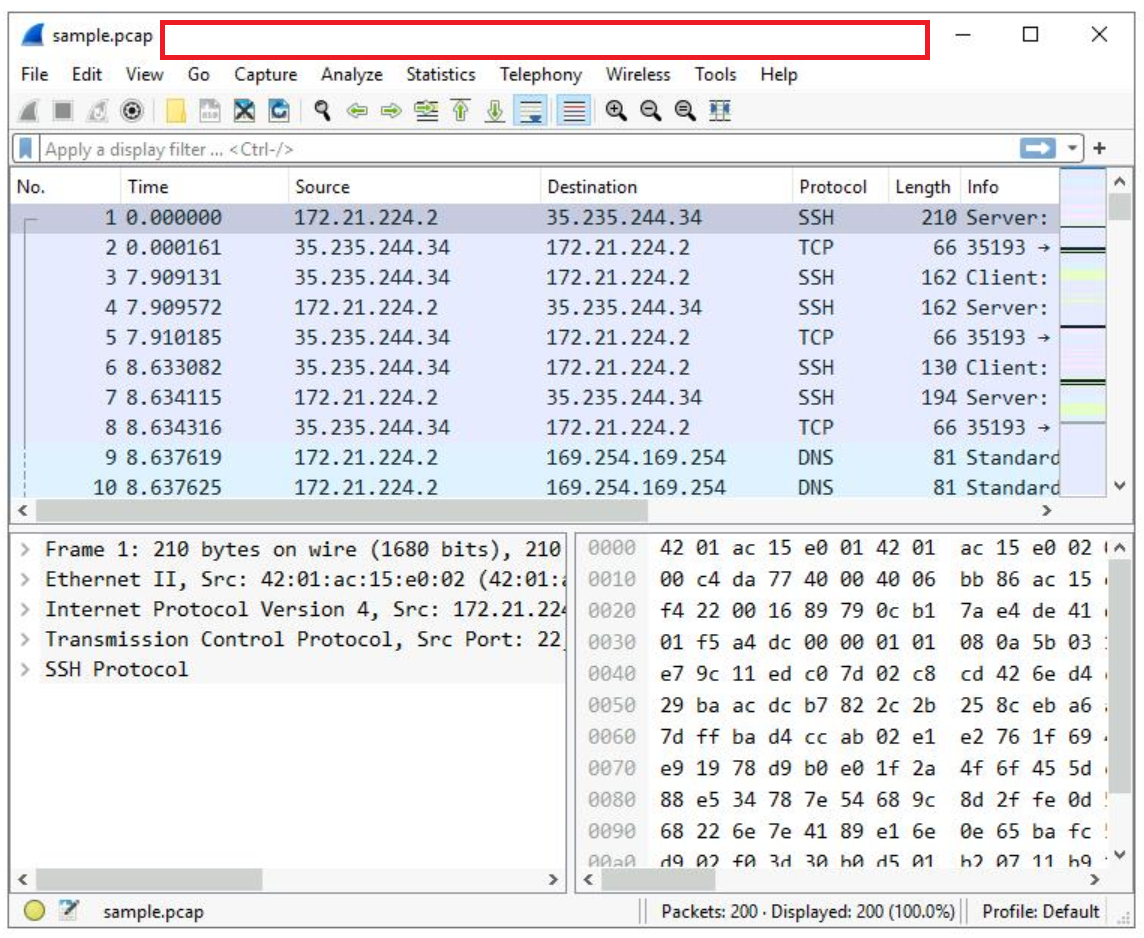
A lot of network packet traffic is listed, which is why you’ll apply filters to find the information needed in an upcoming step.
For now, here is an overview of the key property columns listed for each packet:
Not all the data packets are the same color. Coloring rules are used to provide high-level visual cues to help you quickly classify the different types of data. Since network packet capture files can contain large amounts of data, you can use coloring rules to quickly identify the data that is relevant to you. The example packet lists a group of light blue packets that all contain DNS traffic, followed by green packets that contain a mixture of TCP and HTTP protocol traffic.
In this task, you’ll open a packet in Wireshark for more detailed exploration and filter the data to inspect the network layers and protocols contained in the packet.
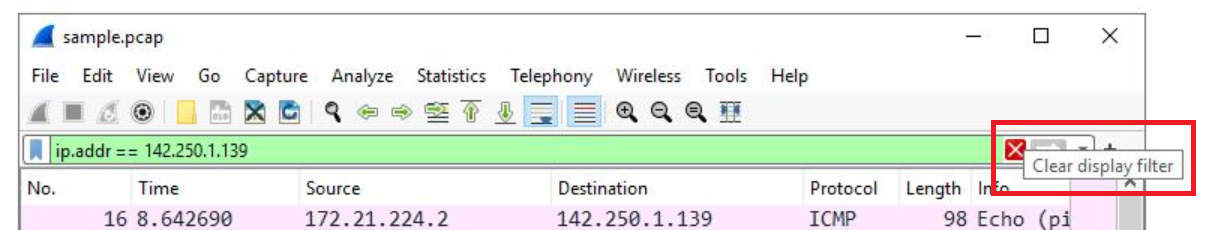
The list of packets displayed is now significantly reduced and contains only packets where either the source or the destination IP address matches the address you entered. Now only two packet colors are used: light pink for ICMP protocol packets and light green for TCP (and HTTP, which is a subset of TCP) packets.
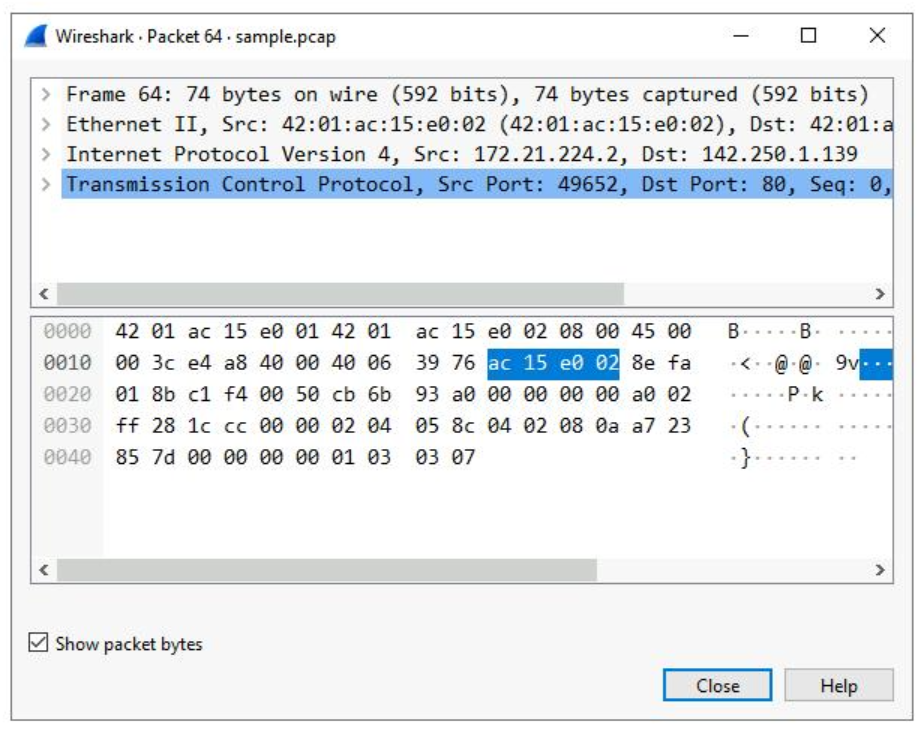
This opens a packet details pane window:
The upper section of this window contains subtrees where Wireshark will provide you with an analysis of the various parts of the network packet. The lower section of the window contains the raw packet data displayed in hexadecimal and ASCII text. There is also placeholder text for fields where the character data does not apply, as indicated by the dot (“.”).
This provides you with details about the overall network packet, or frame, including the frame length and the arrival time of the packet. At this level, you’re viewing information about the entire packet of data.
This item contains details about the packet at the Ethernet level, including the source and destination MAC addresses and the type of internal protocol that the Ethernet packet contains.
This provides packet data about the Internet Protocol (IP) data contained in the Ethernet packet. It contains information such as the source and destination IP addresses and the Internal Protocol (for example, TCP or UDP), which is carried inside the IP packet.
The source and destination IP addresses shown here match the source and destination IP addresses in the summary display for this packet in the main Wireshark window.
This provides detailed information about the TCP packet, including the source and destination TCP ports, the TCP sequence numbers, and the TCP flags.
The source port and destination port listed here match the source and destination ports in the info column of the summary display for this packet in the list of all of the packets in the main Wireshark window.
This provides a detailed view of the TCP flags set in this packet.
Click the X icon to close the detailed packet inspection window.
Click the X Clear display filter icon in the Wireshark filter bar to clear the IP address filter.
All the packets have returned to the display.
If you ever accidentally close the Wireshark application, you can reopen it by double-clicking the sample file on the desktop.
In this task, you’ll use filters to analyze specific network packets based on where the packets came from or where they were sent to. You’ll explore how to select packets using either their physical Ethernet Media Access Control (MAC) address or their Internet Protocol (IP) address.
A filtered list is returned with fewer entries than before. It contains only packets that came from 142.250.1.139.
Click the X Clear display filter icon in the Wireshark filter bar to clear the IP address filter.
Enter the following filter to select traffic for a specific destination IP address only:
A filtered list is returned that contains only packets that were sent to 142.250.1.139.
Click the X Clear display filter icon in the Wireshark filter bar to clear the IP address filter.
Enter the following filter to select traffic to or from a specific Ethernet MAC address. This filters traffic related to one MAC address, regardless of the other protocols involved:
Press ENTER or click the Apply display filter icon in the filter text box.
Double-click the first packet in the list. You may need to scroll back to display the first packet in the filtered list.
Double-click the Ethernet II subtree if it is not already open.
The MAC address you specified in the filter is listed as either the source or destination address in the expanded Ethernet II subtree.
Double-click the Ethernet II subtree to close it.
Double-click the Internet Protocol Version 4 subtree to expand it and scroll down until the Time to Live and Protocol fields appear.
The Protocol field in the Internet Protocol Version 4 subtree indicates which IP internal protocol is contained in the packet.
Click the X icon to close the detailed packet inspection window.
Click the X Clear display filter icon in the Wireshark filter bar to clear the MAC address filter.
In this task, you’ll use filters to select and examine DNS traffic. Once you‘ve selected sample DNS traffic, you’ll drill down into the protocol to examine how the DNS packet data contains both queries (names of internet sites that are being looked up) and answers (IP addresses that are being sent back by a DNS server when a name is successfully resolved).
Press ENTER or click the Apply display filter icon in the filter text box.
Double-click the first packet in the list to open the detailed packet window.
Scroll down and double-click the Domain Name System (query) subtree to expand it.
Scroll down and double-click Queries.
You’ll notice that the name of the website that was queried is opensource.google.com.
Click the X icon to close the detailed packet inspection window.
Double-click the fourth packet in the list to open the detailed packet window.
Scroll down and double-click the Domain Name System (query) subtree to expand it.
Scroll down and double-click Answers, which is in the Domain Name System (query) subtree.
The Answers data includes the name that was queried (opensource.google.com) and the addresses that are associated with that name.
Click the X icon to close the detailed packet inspection window.
Click the X Clear display filter icon in the Wireshark filter bar to clear the filter.
In this task, you’ll use additional filters to select and examine TCP packets. You’ll learn how to search for text that is present in payload data contained inside network packets. This will locate packets based on something such as a name or some other text that is of interest to you.
Quite a few packets were created when the user accessed the web page http://opensource.google.com.
Click the X icon to close the detailed packet inspection window.
Click the X Clear display filter icon in the Wireshark filter bar to clear the filter.
Enter the following filter to select TCP packet data that contains specific text data.
This filters to packets containing web requests made with the curl command in this sample packet capture file.
Great work!
You now have practical experience using Wireshark to
This is an important milestone on your journey toward understanding how to use network packet analysis tools to examine network traffic!
Before you end the lab, make sure you’re satisfied that you’ve completed all the tasks, and follow these steps:


This content is not currently available
We will notify you via email when it becomes available

Great!
We will contact you via email if it becomes available

One lab at a time
Confirm to end all existing labs and start this one
Complete this quick step to start your lab.