Before you begin
- Labs create a Google Cloud project and resources for a fixed time
- Labs have a time limit and no pause feature. If you end the lab, you'll have to restart from the beginning.
- On the top left of your screen, click Start lab to begin

Connect to dataset from Data Studio
/ 100
Connect to dataset from Data Studio
/ 100

 IMPORTANT:
 Make sure to complete this hands-on lab on a desktop/laptop only.
 There are only 5 attempts permitted per lab.
 As a reminder – it is common to not get every question correct on your first try, and even to need to redo a task; this is part of the learning process.
 Once a lab is started, the timer cannot be paused. After 1 hour and 30 minutes, the lab will end and you’ll need to start again.
 For more information review the Lab technical tips reading.
Cloud data analysts use reports to share insights and help users make the most of their data. Data Studio is a cloud-based business intelligence tool that turns data into informative and fully customizable reports.
To get started with Data Studio, you need to connect to a data source. This can be a database, spreadsheet, cloud storage bucket, or API. Once you have connected to a data source, you can select the dimensions and measures that you want to use in your report. In Data Studio, measures are called metrics.
Dimensions are qualitative attributes of data, such as campaign name, product category, or customer location. Measures are quantitative values that you can use to measure data, such as total visitors, sales revenue, or customer satisfaction.
Reports present information and insights derived from your data. You can add charts, graphs, maps, and tables to your reports to visualize data and share insights.
In this lab activity, you'll use Data Studio to build charts and a scorecard using dimensions and measures. You’ll then combine these elements into a marketing campaign performance report that will help identify ways the marketing campaign can improve their efforts.
Martina, the head of marketing, wants to improve the company’s marketing efforts and make them more cost effective.
To support these efforts, Martina has asked you, a member of the data team, to develop a marketing campaign performance report using historical data. The report should focus on past performance in key areas where Martina believes marketing can be more effective.
Martina has identified four key areas where they believe past performance can help the marketing team identify trends and areas for improvement.
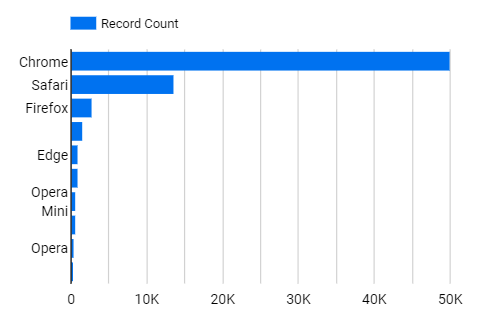
First, Martina has asked you to identify the five most popular browsers used by visitors to the website. This information can be used to help the marketing team understand more about how visitors reach the site and better target their advertising to the browsers used most.
Second, Martina has asked you to identify the total number of unique visitors. This data can be used to track the overall growth of the website's audience and to help the team decide how to best allocate resources and improve your website's performance.
Next, Martina has asked you to identify transactions completed during the annual Jazzy July campaign. This data can be used to assess campaign effectiveness and identify areas for growth.
Finally, Martina has asked you to identify visitor locations across the globe. This data can be used to identify the company's key markets and develop targeted marketing campaigns to improve the company’s reach in the global marketplace.
For this report, you will be working with web traffic data from Google Analytics (GA4) for 2017. The GA4 data already exists in BigQuery.
Here’s how you'll do this: First, you’ll set up a temporary Data Studio environment. Second, you’ll connect to the Google Analytics (GA4) data set. Third, you’ll use a bar chart to visualize the top five browsers used by visitors to the website. Fourth, you’ll create a scorecard to display the total number of visitors to the website in 2017. Then, you’ll identify the location of visitors by country. Finally, you’ll prepare the report to share with others.
Read these instructions. Labs are timed and you cannot pause them. The timer, which starts when you click Start Lab, shows how long Google Cloud resources will be made available to you.
This practical lab lets you do the activities yourself in a real cloud environment, not in a simulation or demo environment. It does so by giving you new, temporary credentials that you use to sign in and access Google Cloud for the duration of the lab.
To complete this lab, you need:
Click the Start Lab button. On the left is the Lab Details panel with the following:
Click Open Google Cloud console (or right-click and select Open Link in Incognito Window) if you are running the Chrome browser. The Sign in page opens in a new browser tab.
Tip: You can arrange the tabs in separate, side-by-side windows to easily switch between them.
If necessary, copy the Google Cloud username below and paste it into the Sign in dialog. Click Next.
You can also find the Google Cloud username in the Lab Details panel.
You can also find the Google Cloud password in the Lab Details panel.
After a few moments, the Console opens in this tab.

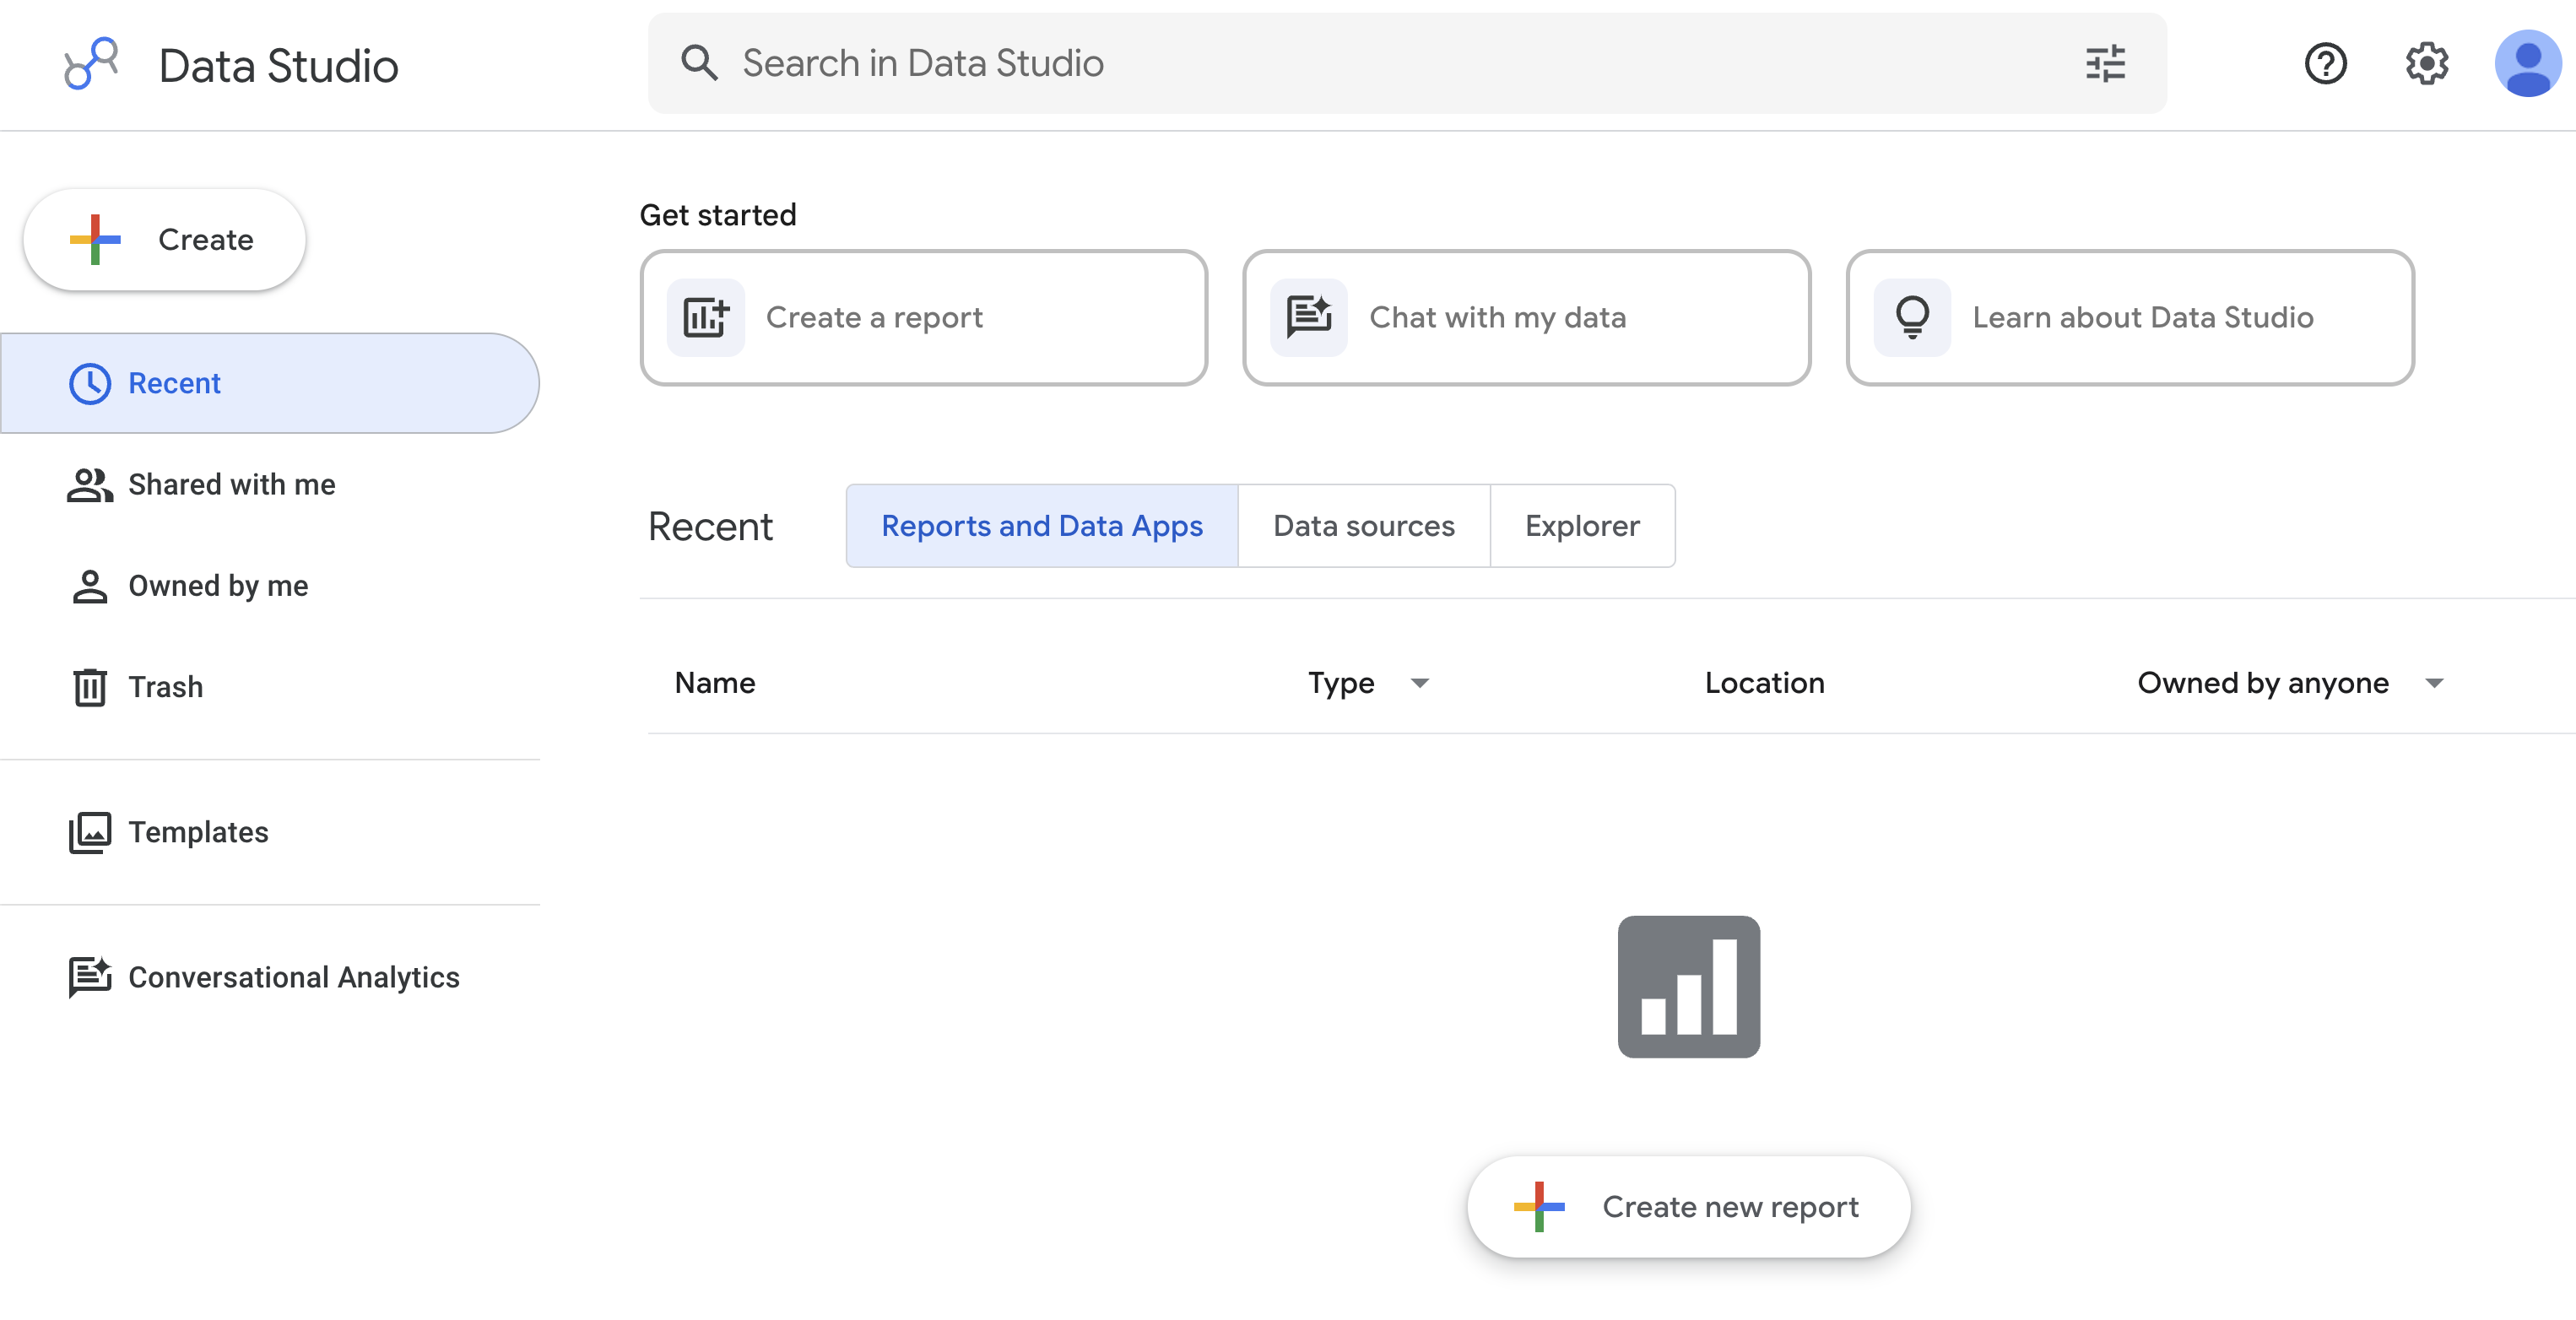
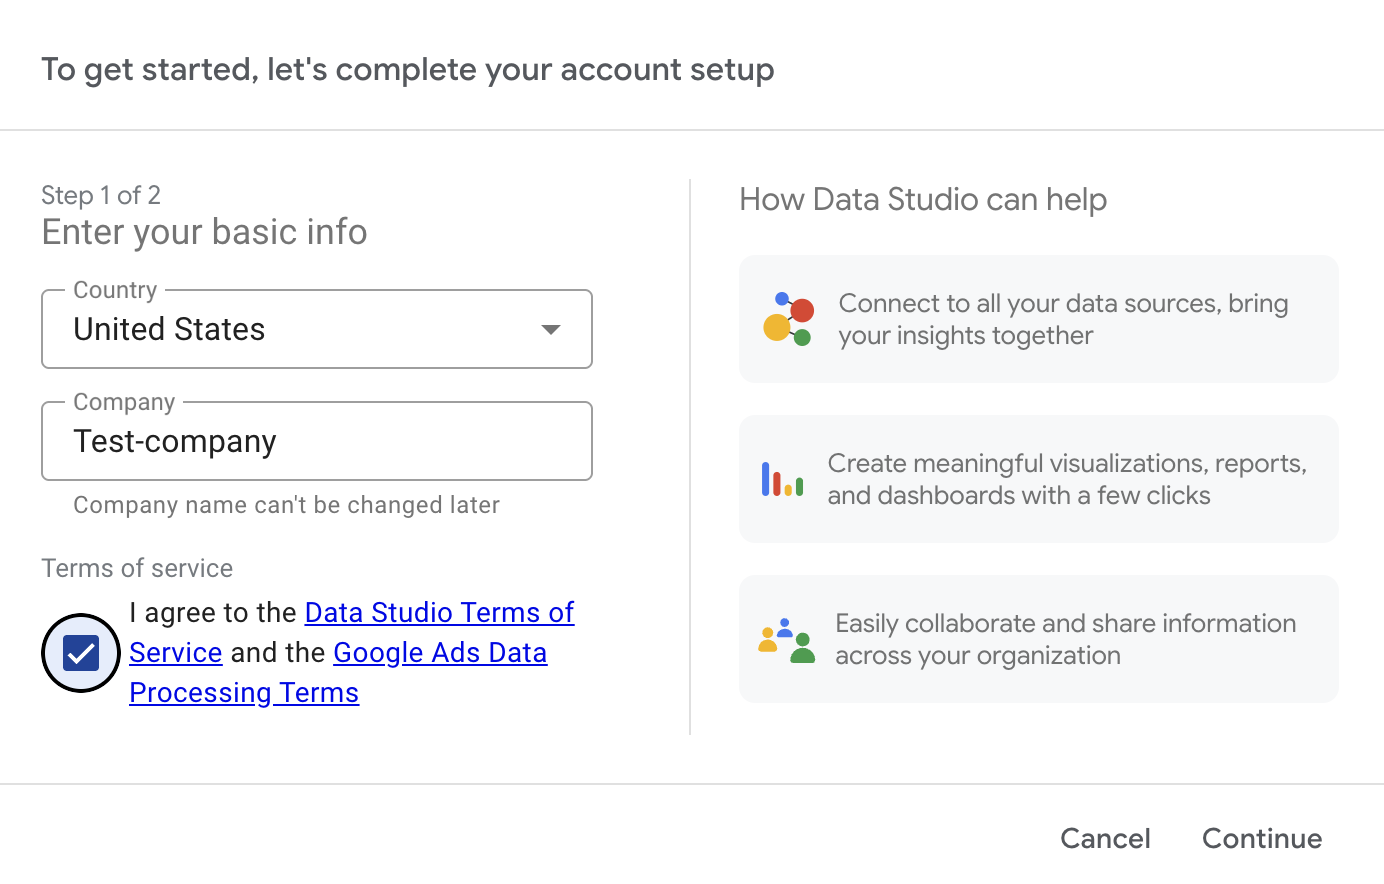
In this task, you will access Data Studio in an incognito session, select the report creation option, and complete the basic account onboarding requirements by configuring your country and company details.
In this task, you will select the BigQuery connector to link your project's GA4 sessions table to the report, and prepare your workspace by removing default table layouts.
In Add data to report, click Connect to data.
In the Google Connectors section, select BigQuery, and click Authorize. A table displays on the Add data to report tab.
Click Check my progress to verify that you have completed this task correctly.
Martina has asked you to identify the top five browsers used by visitors to access the website.
In this task, you will add a bar chart component, configure it to display exactly five browser categories, and define a custom calculated field to represent distinct web traffic.
In the Bar chart properties panel, in the Display section, click the Bars dropdown menu to set the number of bars to 5.
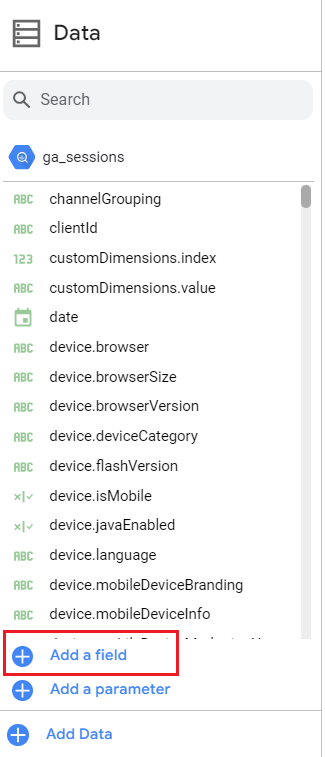
In the Data panel, click Add a field, and then click Add calculated field.
The All Fields dialog opens.
Martina has also asked you to identify the total number of unique visitors to the website. In this task, you will place a scorecard component onto your report canvas and map it to your calculated visitor metric to summarize total unique traffic at a glance.
The total number of visitors across all browsers should display.
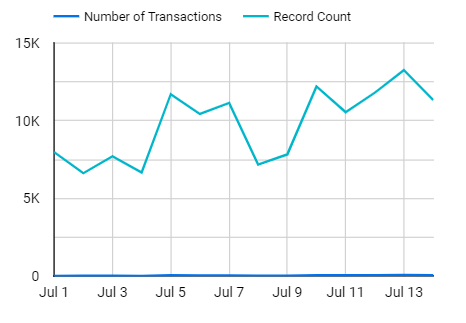
Martina wants to know the total number of transactions during the Jazzy July campaign. In this task, you will build a time series chart, configure it to display a custom date range for the Jazzy July campaign, and add a calculated field to track distinct transaction IDs.
In this task, you will construct a data table categorizing page views by country, insert an advanced filter element, and configure it to query traffic from specific countries.
Notice that the default aggregation for totals.pageviews is sum. The table displays the sum of page views by country.
In the toolbar, select Insert > Advanced filter.
Click on an empty section of the report to drop the advanced filter element onto the canvas.
From the Data panel, drag geonetwork.country to the Control Field section of the Chart panel.
On the Control panel, in the Control field section, ensure that the Search type is shown as Equals.
In the Default value field, type Singapore, and then press ENTER.
The total number of page views to the website in Brazil should be displayed in the geoNetwork.country element.
In this task, you will name the report, add a text title to organize the canvas layout, and enter View mode to preview the finalized dashboard layout.
Great work!
You created a dashboard using Data Studio to help Martina better understand the web traffic data from Google Analytics (GA4) so that they can improve the company’s marketing efforts and make them more cost effective.
First, you practiced connecting a data source to a visualization tool.
Then, you created a visualization that displayed all visitors by browser in a bar chart.
Next, you created a line graph that displayed the total number of transactions made over a specific timeframe.
Finally, you created a table to display all the countries where the website is active and the number of visitors for each country.
With this dashboard, Martina will have an interactive way to understand their data and make data-driven decisions.
Congratulations! You're well on your way to learning how to use Data Studio to visualize and derive insights from your data.
Before you end the lab, make sure you’re satisfied that you’ve completed all the tasks. When you're ready, click End Lab and then click Submit.
Ending the lab will remove your access to the lab environment, and you won’t be able to access the work you've completed in it again.
Copyright 2026 Google LLC All rights reserved. Google and the Google logo are trademarks of Google LLC. All other company and product names may be trademarks of the respective companies with which they are associated.



This content is not currently available
We can notify you via email when it becomes available

Great!
We can contact you via email if it becomes available


One lab at a time
Confirm to end all existing labs and start this one