This lab was developed with our partner, Datadog. Your personal information may be shared with Datadog, the lab sponsor, if you have opted-in to receive product updates, announcements, and offers in your Account Profile.
Note: this lab requires a partner account. Please follow the lab instructions to create your account before starting the lab.
GSP937

Overview
The Datadog Agent has many features. In this lab you will run the Datadog Agent in a Kubernetes cluster as a DaemonSet in order to start collecting your cluster and applications metrics, traces, and logs. You can deploy a Datadog Agent with a Helm chart or directly with a DaemonSet object YAML definition.
In this lab you will be explaining and using those options in a real cluster, checking in real time the features they enable.
Objectives
In this lab you will learn about using the Helm chart used to install the Datadog Agent. You will learn how to:
- Deploy the Datadog Helm chart
- Add a toleration to the agent
- Change configuration values from the Helm chart
- Check the logs
- Enable the APM agent
- Enable the cluster agent
Setup and requirements
Before you click the Start Lab button
Read these instructions. Labs are timed and you cannot pause them. The timer, which starts when you click Start Lab, shows how long Google Cloud resources are made available to you.
This hands-on lab lets you do the lab activities in a real cloud environment, not in a simulation or demo environment. It does so by giving you new, temporary credentials you use to sign in and access Google Cloud for the duration of the lab.
To complete this lab, you need:
- Access to a standard internet browser (Chrome browser recommended).
Note: Use an Incognito (recommended) or private browser window to run this lab. This prevents conflicts between your personal account and the student account, which may cause extra charges incurred to your personal account.
- Time to complete the lab—remember, once you start, you cannot pause a lab.
Note: Use only the student account for this lab. If you use a different Google Cloud account, you may incur charges to that account.
How to start your lab and sign in to the Google Cloud console
-
Click the Start Lab button. If you need to pay for the lab, a dialog opens for you to select your payment method.
On the left is the Lab Details pane with the following:
- The Open Google Cloud console button
- Time remaining
- The temporary credentials that you must use for this lab
- Other information, if needed, to step through this lab
-
Click Open Google Cloud console (or right-click and select Open Link in Incognito Window if you are running the Chrome browser).
The lab spins up resources, and then opens another tab that shows the Sign in page.
Tip: Arrange the tabs in separate windows, side-by-side.
Note: If you see the Choose an account dialog, click Use Another Account.
-
If necessary, copy the Username below and paste it into the Sign in dialog.
{{{user_0.username | "Username"}}}
You can also find the Username in the Lab Details pane.
-
Click Next.
-
Copy the Password below and paste it into the Welcome dialog.
{{{user_0.password | "Password"}}}
You can also find the Password in the Lab Details pane.
-
Click Next.
Important: You must use the credentials the lab provides you. Do not use your Google Cloud account credentials.
Note: Using your own Google Cloud account for this lab may incur extra charges.
-
Click through the subsequent pages:
- Accept the terms and conditions.
- Do not add recovery options or two-factor authentication (because this is a temporary account).
- Do not sign up for free trials.
After a few moments, the Google Cloud console opens in this tab.
Note: To access Google Cloud products and services, click the Navigation menu or type the service or product name in the Search field.

Activate Cloud Shell
Cloud Shell is a virtual machine that is loaded with development tools. It offers a persistent 5GB home directory and runs on the Google Cloud. Cloud Shell provides command-line access to your Google Cloud resources.
-
Click Activate Cloud Shell  at the top of the Google Cloud console.
-
Click through the following windows:
- Continue through the Cloud Shell information window.
- Authorize Cloud Shell to use your credentials to make Google Cloud API calls.
When you are connected, you are already authenticated, and the project is set to your Project_ID, . The output contains a line that declares the Project_ID for this session:
Your Cloud Platform project in this session is set to {{{project_0.project_id | "PROJECT_ID"}}}
gcloud is the command-line tool for Google Cloud. It comes pre-installed on Cloud Shell and supports tab-completion.
- (Optional) You can list the active account name with this command:
gcloud auth list
- Click Authorize.
Output:
ACTIVE: *
ACCOUNT: {{{user_0.username | "ACCOUNT"}}}
To set the active account, run:
$ gcloud config set account `ACCOUNT`
- (Optional) You can list the project ID with this command:
gcloud config list project
Output:
[core]
project = {{{project_0.project_id | "PROJECT_ID"}}}
Note: For full documentation of gcloud, in Google Cloud, refer to the gcloud CLI overview guide.
Task 1. Clone the repo
- In Cloud Shell, run the following commands to clone the repo, add the Datadog repository, and authenticate the pre-created cluster:
git clone https://github.com/arapulido/dd-helm-chart-values.git
helm repo add datadog https://helm.datadoghq.com
helm repo update
gcloud container clusters get-credentials datadog-cluster-demo --zone {{{my_primary_project.default_zone|ZONE}}}
Next, set up a Datadog Trial account to use in the lab. If you already have a trial account set up, you can use that. It is recommend that you do not use your production Datadog account to avoid cluttering the environment with test and training assets.
-
Navigate to the Datadog sign up page and enter your name, email, company, and a password.
-
Next, select your software stack. In this lab you will be using Google Cloud Platform and Kubernetes, then click Next.
__NOTE:__ If you already had a Datadog account, navigate to __Agent__.
On the next page, you will see a list of available Agent installations.
-
Click Kubernetes.
-
Select Helm Chart as the Installation Method.
-
In Add the Datadog Helm Repository, click on the api-key value to reveal it. This will bring up a window where you need to select an existing API key or create a new one. Click Use API key.
-
Click on the api-key box to see the Datadog API Key. Copy it to your clipboard.
-
Back in the Cloud Console, navigate back to your Cloud Shell window.
-
Run the following command, replacing <YOUR_DATADOG_API_KEY>with your API key in the appropriate slot:
export DD_API_KEY=<YOUR_DATADOG_API_KEY>
- Ensure your environment is ready by running:
kubectl get nodes
You should see:
NAME STATUS ROLES AGE VERSION
gke-datadog-cluster-demo-default-pool-2ad2ff67-p8j0 Ready 21m v1.20.8-gke.900
gke-datadog-cluster-demo-default-pool-2ad2ff67-r8ql Ready 21m v1.20.8-gke.900
Task 2. Deploy the Datadog Helm chart
In this section, you will deploy the Datadog Helm chart without any additional options. When that happens, the Helm chart will get deployed with the default values.yaml that comes with the chart. You can check these default values in the Helm chart Github repository.
- Start by deploying the chart, passing in your API key:
helm install datadog --set datadog.apiKey=$DD_API_KEY datadog/datadog -f dd-helm-chart-values/values.yaml --set agents.image.doNotCheckTag=true --set clusterAgent.image.doNotCheckTag=true --set clusterAgent.enabled=true
Note: You may get a deprecation warning, you can ignore that.
Click Check my progress to verify the objective.
Deploy the Datadog Helm chart
- Run the following to check the secrets that were created:
kubectl get secrets
You should get an output similar to this:
NAME TYPE DATA AGE
datadog Opaque 1 5m33s
sh.helm.release.v1.datadog.v1 helm.sh/release.v1 1 5m35s
The most important one is the one called datadog. This is a secret that was automatically created that contains your API key.
- Check that the secret actually contains your API key getting the value and base64 decoding it:
kubectl get secret datadog --template='{{index .data "api-key"}}' | base64 -d
The other two token secrets are the ones used by the service accounts to communicate with the API server.
- Let's check the workloads that have been deployed:
kubectl get deployments
NAME READY UP-TO-DATE AVAILABLE AGE
datadog-kube-state-metrics 1/1 1 1 15h
The Datadog Helm chart, by default, aside from the Datadog agent, deploys Kube State Metrics by default. Kube State Metrics is a service that listens to the Kubernetes API and generates metrics about the state of the objects. Datadog uses some of these metrics to populate its Kubernetes default dashboard.
This is the Daemonset that deploys the Datadog node agent. To be able to gather information from the Kubelet and system metrics from each of the nodes, the Datadog node agent deploys at least 1 node agent pod per node.
- Run the following command to verify the Datadog Agent is running in your environment as a DaemonSet:
kubectl get daemonset
NAME DESIRED CURRENT READY UP-TO-DATE AVAILABLE NODE SELECTOR AGE
datadog 2 2 2 2 2 kubernetes.io/os=linux 34s
- Check how many pods you have after deploying the Daemonset and which nodes are they deployed to:
kubectl get pods -l app=datadog -o custom-columns=NAME:.metadata.name,NODE:.spec.nodeName
You should get an output similar to this one:
NAME NODE
datadog-cg9f8 gke-datadog-cluster-demo-default-pool-2ad2ff67-r8ql
datadog-nmzll gke-datadog-cluster-demo-default-pool-2ad2ff67-p8j0
The Datadog node agent was deployed to the two worker nodes. If you were running a Kubernetes cluster outside of the Google Kubernetes Engine, you would have a control plane node but the agent wouldn’t be installed there. Why?
There is a taint in the control plane node that prevents pods without the corresponding toleration being scheduled in that node:
kubectl get nodes controlplane -o custom-columns=NAME:.metadata.name,TAINTS:.spec.taints
If you want to monitor the control plane nodes, you need to add a toleration for the control-plane nodes. The next step will explain how.
- Check the status of the Datadog agent:
kubectl exec -ti $(kubectl get pods -l app=datadog -o custom-columns=:metadata.name) -- agent status
- Check the output and look at the different checks that are running by default.
Task 3. Add a toleration to the agent
As mentioned before, the cluster has two nodes because you are running in the Google Kubernetes Engine. On other platforms you would also have a control plane node. In those cases, the agent would only be deployed to the worker nodes. This section shows you what you would have to do to add a toleration to allow the agent to be installed on the control plane. This is fairly easy to do using the Datadog Helm chart, as there is a specific section in the values.yaml file to add tolerations.
-
Click the Open Editor button on the toolbar of Cloud Shell. (You can switch between Cloud Shell and the code editor by using the Open Editor and Open Terminal icons as required, or click the Open in new window button to leave the Editor open in a separate tab).
-
In the Editor, navigate to dd-helm-chart-values/values.yaml.
-
Around line 1071, find the following lines:
## @param tolerations - array - optional
## Allow the DaemonSet to schedule on tainted nodes (requires Kubernetes >= 1.6)
#
tolerations: []
- You are going to edit the file so that the section looks like the following:
## @param tolerations - array - optional
## Allow the DaemonSet to schedule on tainted nodes (requires Kubernetes >= 1.6)
#
tolerations:
- key: node-role.kubernetes.io/master
effect: NoSchedule
You have a values-tolerations.yaml file already with that section.
- Check the diff between the two values files:
diff dd-helm-chart-values/values.yaml dd-helm-chart-values/values-tolerations.yaml
- To apply it, run the
helm upgrade command. Again, since you are running this on GKE (Google Kubernetes Engine), there isn’t a control plane node that you can access.
helm upgrade datadog --set datadog.apiKey=$DD_API_KEY datadog/datadog -f dd-helm-chart-values/values-tolerations.yaml --set agents.image.doNotCheckTag=true --set clusterAgent.image.doNotCheckTag=true --set clusterAgent.enabled=true
Click Check my progress to verify the objective.
Add a toleration to the agent
Task 4. Change configuration values from the Helm chart
Explore how to change some configuration values from the Helm chart. When installing Kubernetes from scratch, there are hundreds of potential configuration choices. As a result, setting up the agent isn’t always perfect the first time. For example, suppose there was an issue with the Kubelet.
You could run the agent status command in the Datadog's agent pod running in the worker node to try to determine what the problem is.
Note: This is an example do not run this command - running this command will return an error with your configuration.
kubectl exec -ti $(kubectl get pods -l app=datadog -o custom-columns=:.metadata.name --field-selector spec.nodeName=node01) -- agent status
Say you are getting this error:
kubelet (4.1.1)
---------------
Instance ID: kubelet:d884b5186b651429 [ERROR]
Configuration Source: file:/etc/datadog-agent/conf.d/kubelet.d/conf.yaml.default
Total Runs: 37
Metric Samples: Last Run: 0, Total: 0
Events: Last Run: 0, Total: 0
Service Checks: Last Run: 0, Total: 0
Average Execution Time : 0s
Last Execution Date : 2020-09-11 13:24:02.000000 UTC
Last Successful Execution Date : Never
Error: Unable to detect the kubelet URL automatically.
Traceback (most recent call last):
File "/opt/datadog-agent/embedded/lib/python3.8/site-packages/datadog_checks/base/checks/base.py", line 841, in run
self.check(instance)
File "/opt/datadog-agent/embedded/lib/python3.8/site-packages/datadog_checks/kubelet/kubelet.py", line 297, in check
raise CheckException("Unable to detect the kubelet URL automatically.")
datadog_checks.base.errors.CheckException: Unable to detect the kubelet URL automatically.
That error happens because you cannot verify the Kubelet certificates correctly. It’s pretty common in development clusters since getting the certificates is a multi-step process and not entirely needed in non-production environments. To solve this you would tell the Datadog agent to skip the TLS verification by setting the environment variable called DD_KUBELET_TLS_VERIFY to false.
- Setting environment variables in the
values.yaml file is easy: there is a section to do just that:
## @param env - list of object - optional
## The dd-agent supports many environment variables
## ref: https://docs.datadoghq.com/agent/docker/?tab=standard#environment-variables
#
env: []
- Here is how to set that environment variable:
## @param env - list of object - optional
## The dd-agent supports many environment variables
## ref: https://docs.datadoghq.com/agent/docker/?tab=standard#environment-variables
#
env:
- name: DD_KUBELET_TLS_VERIFY
value: false
You have a values-kubelet.yaml file already with that section.
- You can check the difference between the previous applied values file:
diff dd-helm-chart-values/values-tolerations.yaml dd-helm-chart-values/values-kubelet.yaml
- To apply the updated helm values, run this command:
helm upgrade datadog --set datadog.apiKey=$DD_API_KEY datadog/datadog -f dd-helm-chart-values/values-kubelet.yaml --set agents.image.doNotCheckTag=true --set clusterAgent.image.doNotCheckTag=true --set clusterAgent.enabled=true
Click Check my progress to verify the objective.
Change configuration values from the Helm chart
- Then run the agent status command in the Datadog's agent pod running in the worker node.
Note: This is an example - running this command will return an error with your configuration.
kubectl exec -ti $(kubectl get pods -l app=datadog -o custom-columns=:.metadata.name --field-selector spec.nodeName=node01) -- agent status
For this particular example, the Kubelet check would now run now successfully.
Task 5. Check the logs
Logs collection is disabled by default in the Datadog Helm chart default values.
- Check that the logs agent is not currently running:
kubectl exec -ti $(kubectl get pods -l app=datadog -o custom-columns=:.metadata.name) -- agent status
You should see the following:
...
==========
Logs Agent
==========
Logs Agent is not running
...
- There is a section in the
values.yaml (around line 217) file to enable log collection easily:
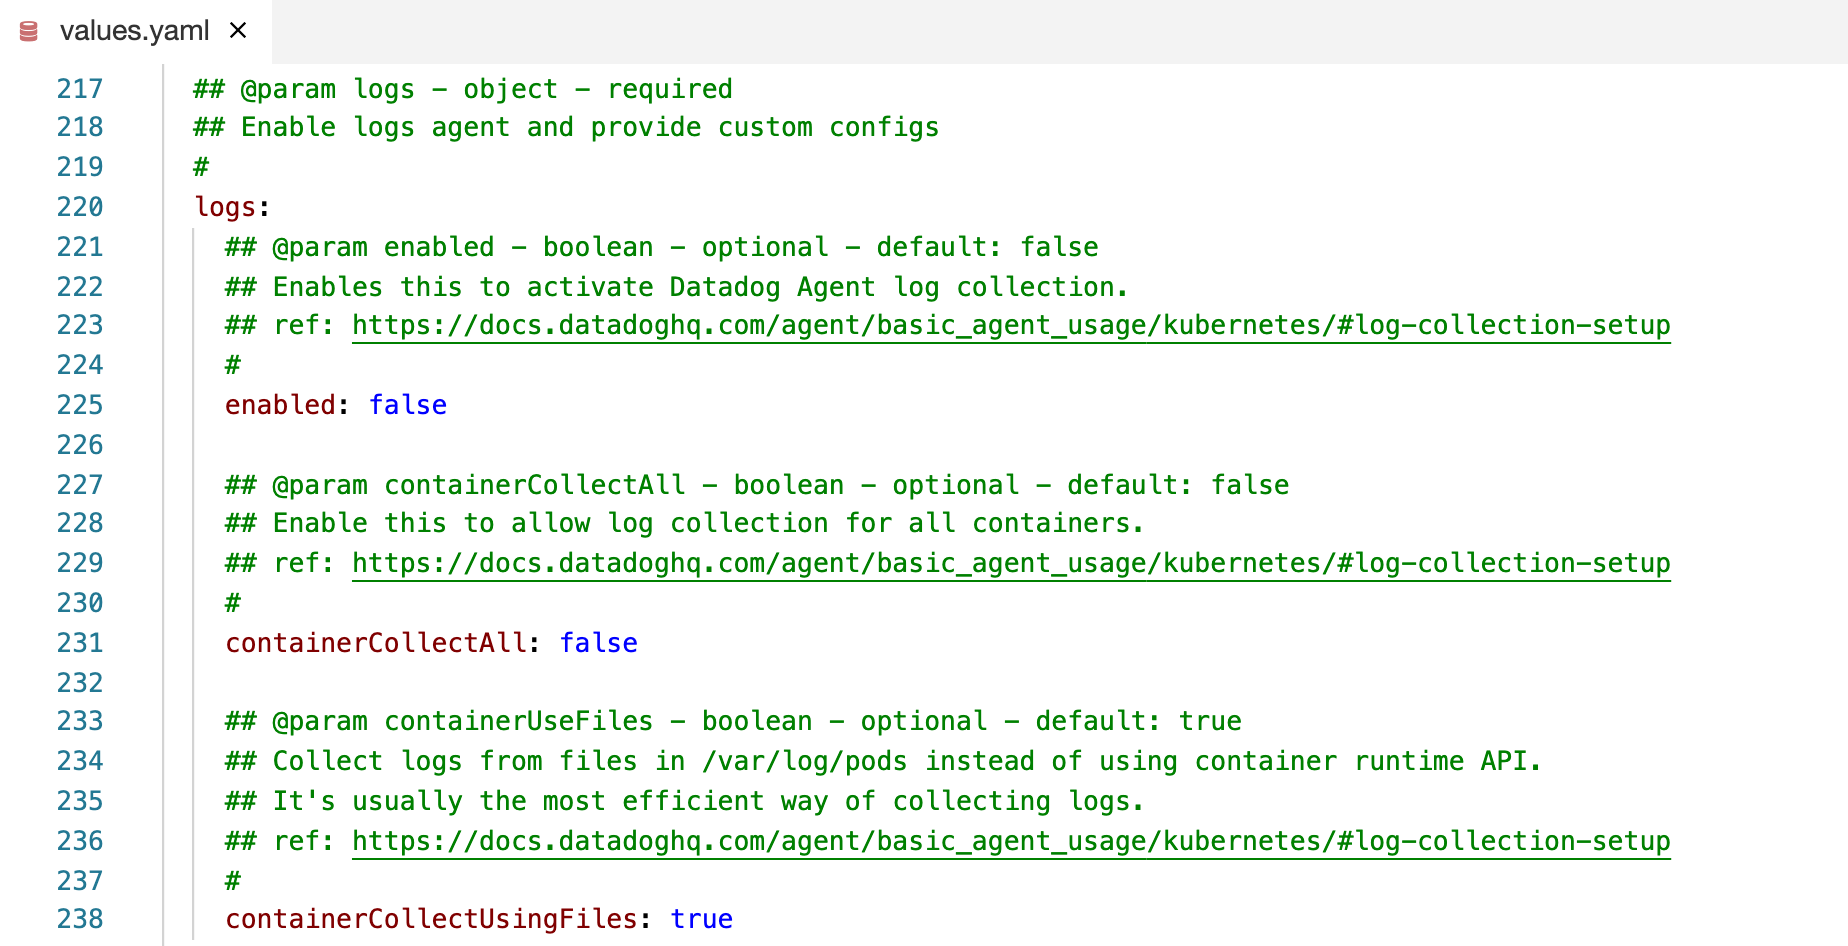
- Set both
enabled and containerCollectAll to true, to enable log collection and to collect logs from all containers in the cluster.
You have a values-logs.yaml file already with that section.
- Check the difference between the previous applied values file:
diff -U5 dd-helm-chart-values/values-kubelet.yaml dd-helm-chart-values/values-logs.yaml
- Apply it:
helm upgrade datadog --set datadog.apiKey=$DD_API_KEY datadog/datadog -f dd-helm-chart-values/values-logs.yaml --set agents.image.doNotCheckTag=true --set clusterAgent.image.doNotCheckTag=true --set clusterAgent.enabled=true
Click Check my progress to verify the objective.
Check the logs
6. Let's run again the agent status command in the Datadog's agent pod running in the worker node:
kubectl exec -ti $(kubectl get pods -l app=datadog -o custom-columns=:.metadata.name) -- agent status
Log collection should be enabled now:
==========
Logs Agent
==========
Sending compressed logs in HTTPS to agent-http-intake.logs.datadoghq.com on port 443
BytesSent: 0
EncodedBytesSent: 28
LogsProcessed: 0
LogsSent: 0
Task 6. Enable the APM agent
The APM (tracing) agent is also disabled by default in the Datadog Helm chart default values.
- Check that the APM agent is not currently running:
kubectl exec -ti $(kubectl get pods -l app=datadog -o custom-columns=:.metadata.name) -- agent status
You should get the following:
...
=========
APM Agent
=========
Status: Not running or unreachable on localhost:8126.
Error: Get http://localhost:8126/debug/vars: dial tcp 127.0.0.1:8126: connect: connection refused
...
- There is a section in the
values.yaml file (around line 240) to enable APM easily:
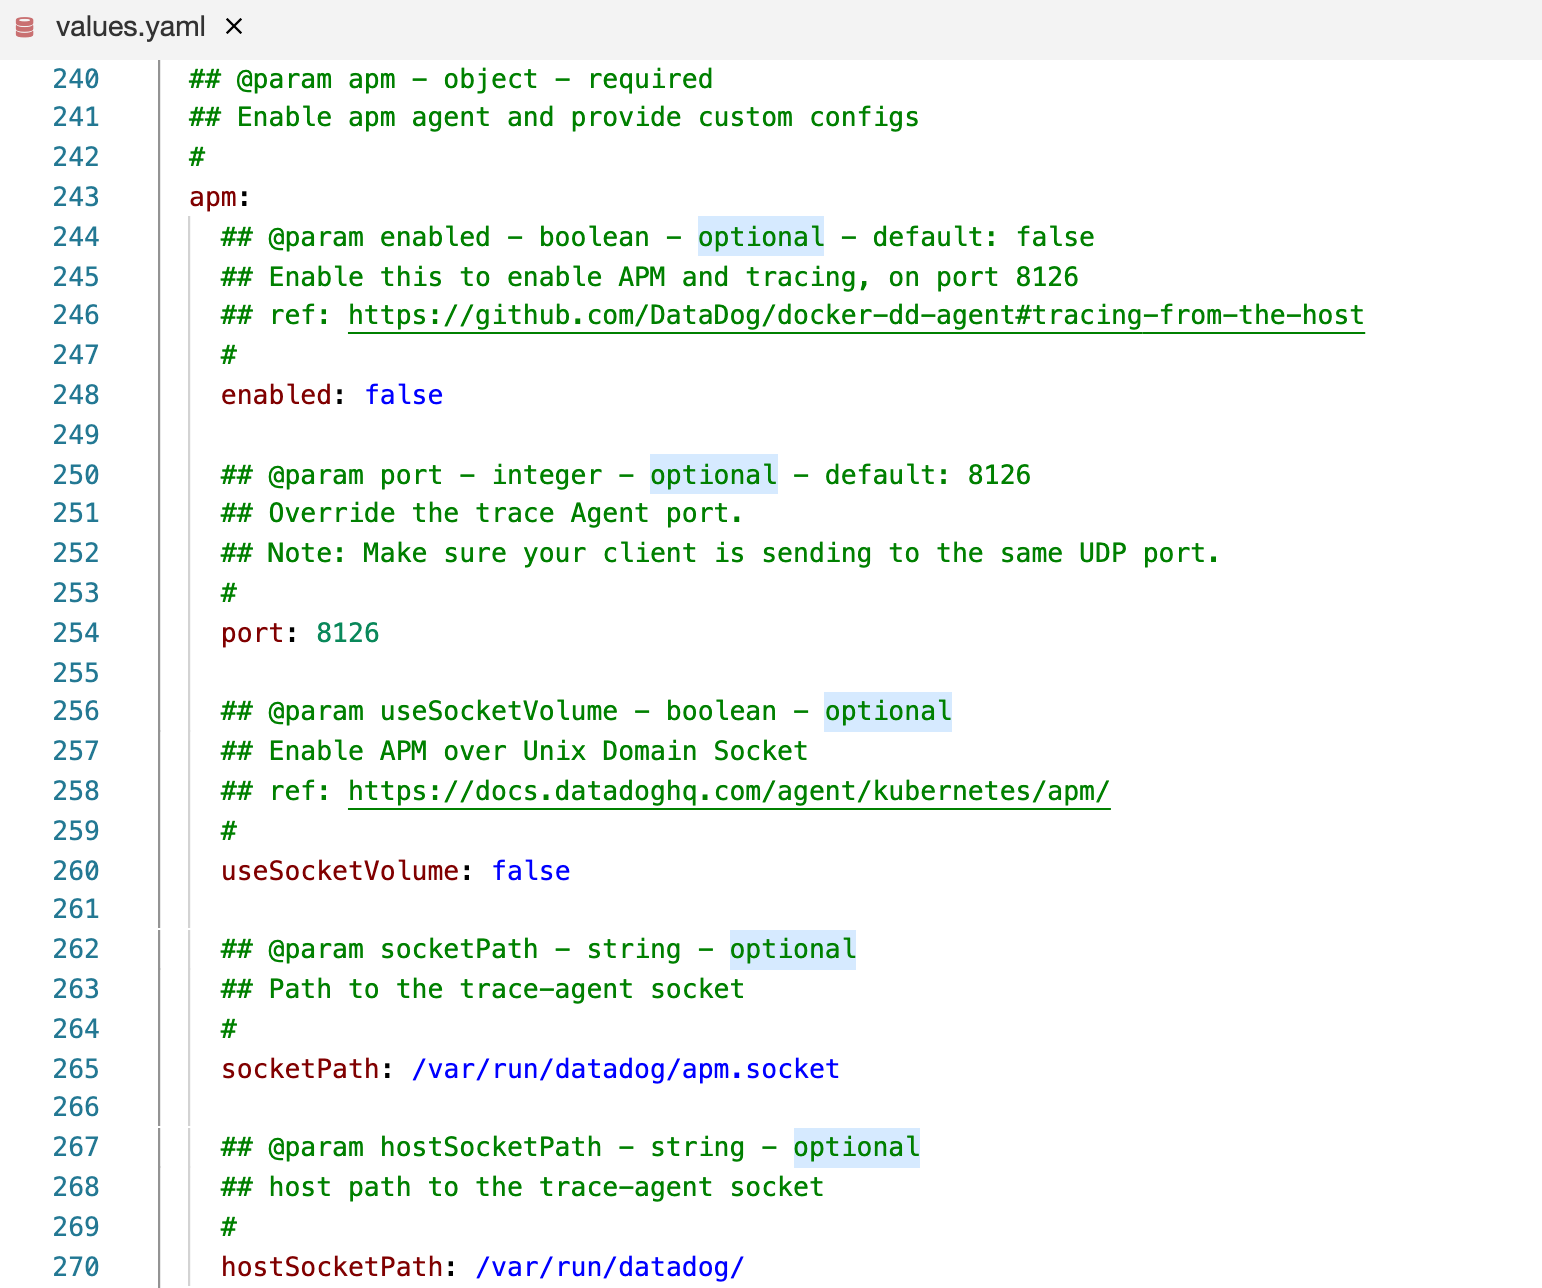
- You are going to enable APM and, instead of using UDP for the communication, you are going to use a Unix Domain Socket, setting
enabled and useSocketVolume to true.
You have a values-apm.yaml file already with that section.
- You can check the difference between the previous applied values file:
diff -U5 dd-helm-chart-values/values-logs.yaml dd-helm-chart-values/values-apm.yaml
- Apply it:
helm upgrade datadog --set datadog.apiKey=$DD_API_KEY datadog/datadog -f dd-helm-chart-values/values-apm.yaml --set agents.image.doNotCheckTag=true --set clusterAgent.image.doNotCheckTag=true --set clusterAgent.enabled=true
- Run the agent status command again in the Datadog's agent pod running in the worker node:
kubectl exec -ti $(kubectl get pods -l app=datadog -o custom-columns=:.metadata.name) -- agent status
Log collection should be enabled now:
=========
APM Agent
=========
Status: Running
Pid: 1
Uptime: 40 seconds
Mem alloc: 12,337,632 bytes
Hostname: node01
Receiver: 0.0.0.0:8126
Endpoints:
https://trace.agent.datadoghq.com
Receiver (previous minute)
==========================
No traces received in the previous minute.
Default priority sampling rate: 100.0%
Writer (previous minute)
========================
Traces: 0 payloads, 0 traces, 0 events, 0 bytes
Stats: 0 payloads, 0 stats buckets, 0 bytes
Task 7. Enable the Cluster agent
Right now you have deployed Datadog's node agent. A Daemonset that ensures at least 1 replica per node in our cluster.
Another type of Datadog's Kubernetes agent is the Cluster Agent, that acts a proxy between the API server and the agents, and provides cluster level monitoring data.
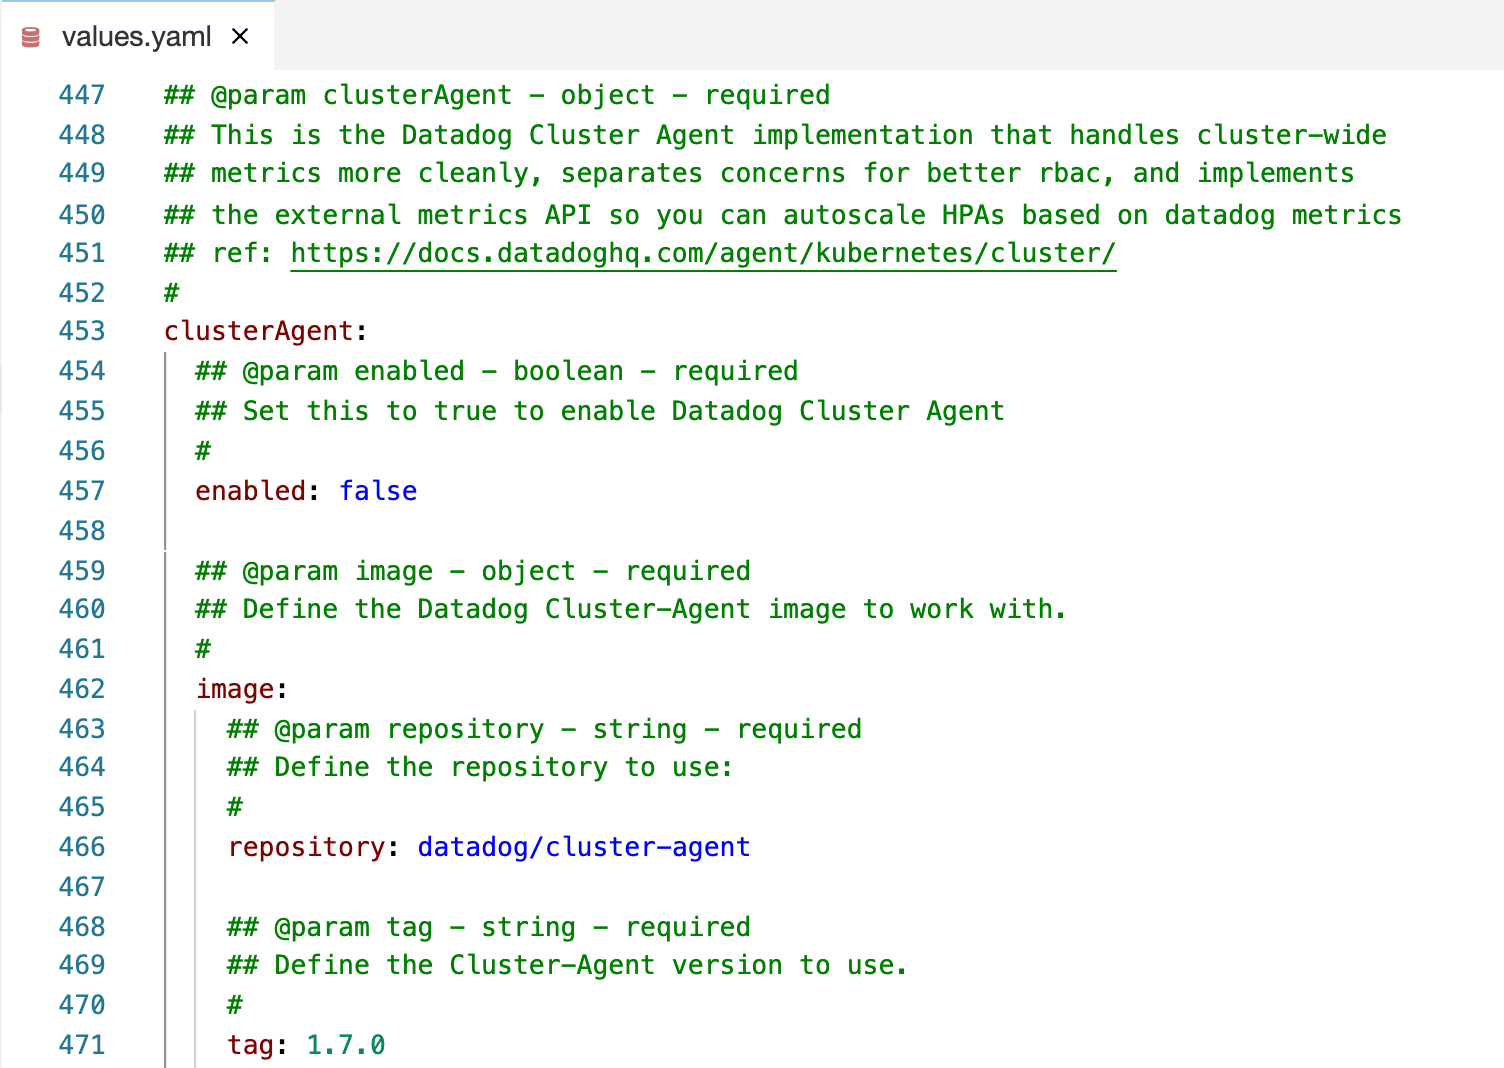
The Cluster Agent is disabled by default in the Datadog Helm chart default values and in this environment since you don’t have access to the control plane you aren’t able to completely install it. But depending on where you run Kubernetes you may have to monitor the control plane. There is a section in the values.yaml file to enable the Cluster Agent and to set the number of replicas:
-
To enable the Cluster Agent, around line 457 change enabled to true.
-
You have a values-cluster-agent.yaml file already with that section. You can check the difference between the previous applied values file:
diff -U4 dd-helm-chart-values/values-apm.yaml dd-helm-chart-values/values-cluster-agent.yaml
- To apply it run:
helm upgrade datadog --set datadog.apiKey=$DD_API_KEY datadog/datadog -f dd-helm-chart-values/values-cluster-agent.yaml --set agents.image.doNotCheckTag=true --set clusterAgent.image.doNotCheckTag=true --set clusterAgent.enabled=true
Click Check my progress to verify the objective.
Enable the Cluster Agent
- Then run a command like this to check the Datadog cluster agent status:
kubectl exec -ti $(kubectl get pods -l app=datadog -o custom-columns=:.metadata.name) -- agent status
The resulting output would look similar to this one:
...
=====================
Datadog Cluster Agent
=====================
- Datadog Cluster Agent endpoint detected: https://10.98.143.176:5005
Successfully connected to the Datadog Cluster Agent.
- Running: 1.7.0+commit.4568d4d
- And then run the agent
status command in the Cluster Agent pod:
kubectl exec -ti $(kubectl get pods -l app=datadog-cluster-agent -o custom-columns=:.metadata.name) -- agent status
And you would see something like this:
kubernetes_apiserver
--------------------
Instance ID: kubernetes_apiserver [OK]
Configuration Source: file:/etc/datadog-agent/conf.d/kubernetes_apiserver.d/conf.yaml.default
Total Runs: 111
Metric Samples: Last Run: 0, Total: 0
Events: Last Run: 0, Total: 0
Service Checks: Last Run: 3, Total: 333
Average Execution Time : 15ms
Last Execution Date : 2020-09-14 14:19:40.000000 UTC
Last Successful Execution Date : 2020-09-14 14:19:40.000000 UTC
Congratulations!
In this lab you got hands-on experience using the Datadog Helm Chart and installed the Datadog Agent.
Next steps / Learn more
Be sure to check out the following labs for more practice with Datadog:
Google Cloud training and certification
...helps you make the most of Google Cloud technologies. Our classes include technical skills and best practices to help you get up to speed quickly and continue your learning journey. We offer fundamental to advanced level training, with on-demand, live, and virtual options to suit your busy schedule. Certifications help you validate and prove your skill and expertise in Google Cloud technologies.
Manual Last Updated May 14, 2024
Lab Last Tested October 3, 2023
Copyright 2026 Google LLC All rights reserved. Google and the Google logo are trademarks of Google LLC. All other company and product names may be trademarks of the respective companies with which they are associated.