GSP087

Overview
Using autoscaling in a Compute Engine Managed Instance Group (MIG) ensures your application is reliable and cost-efficient by automatically matching its capacity to user demand.
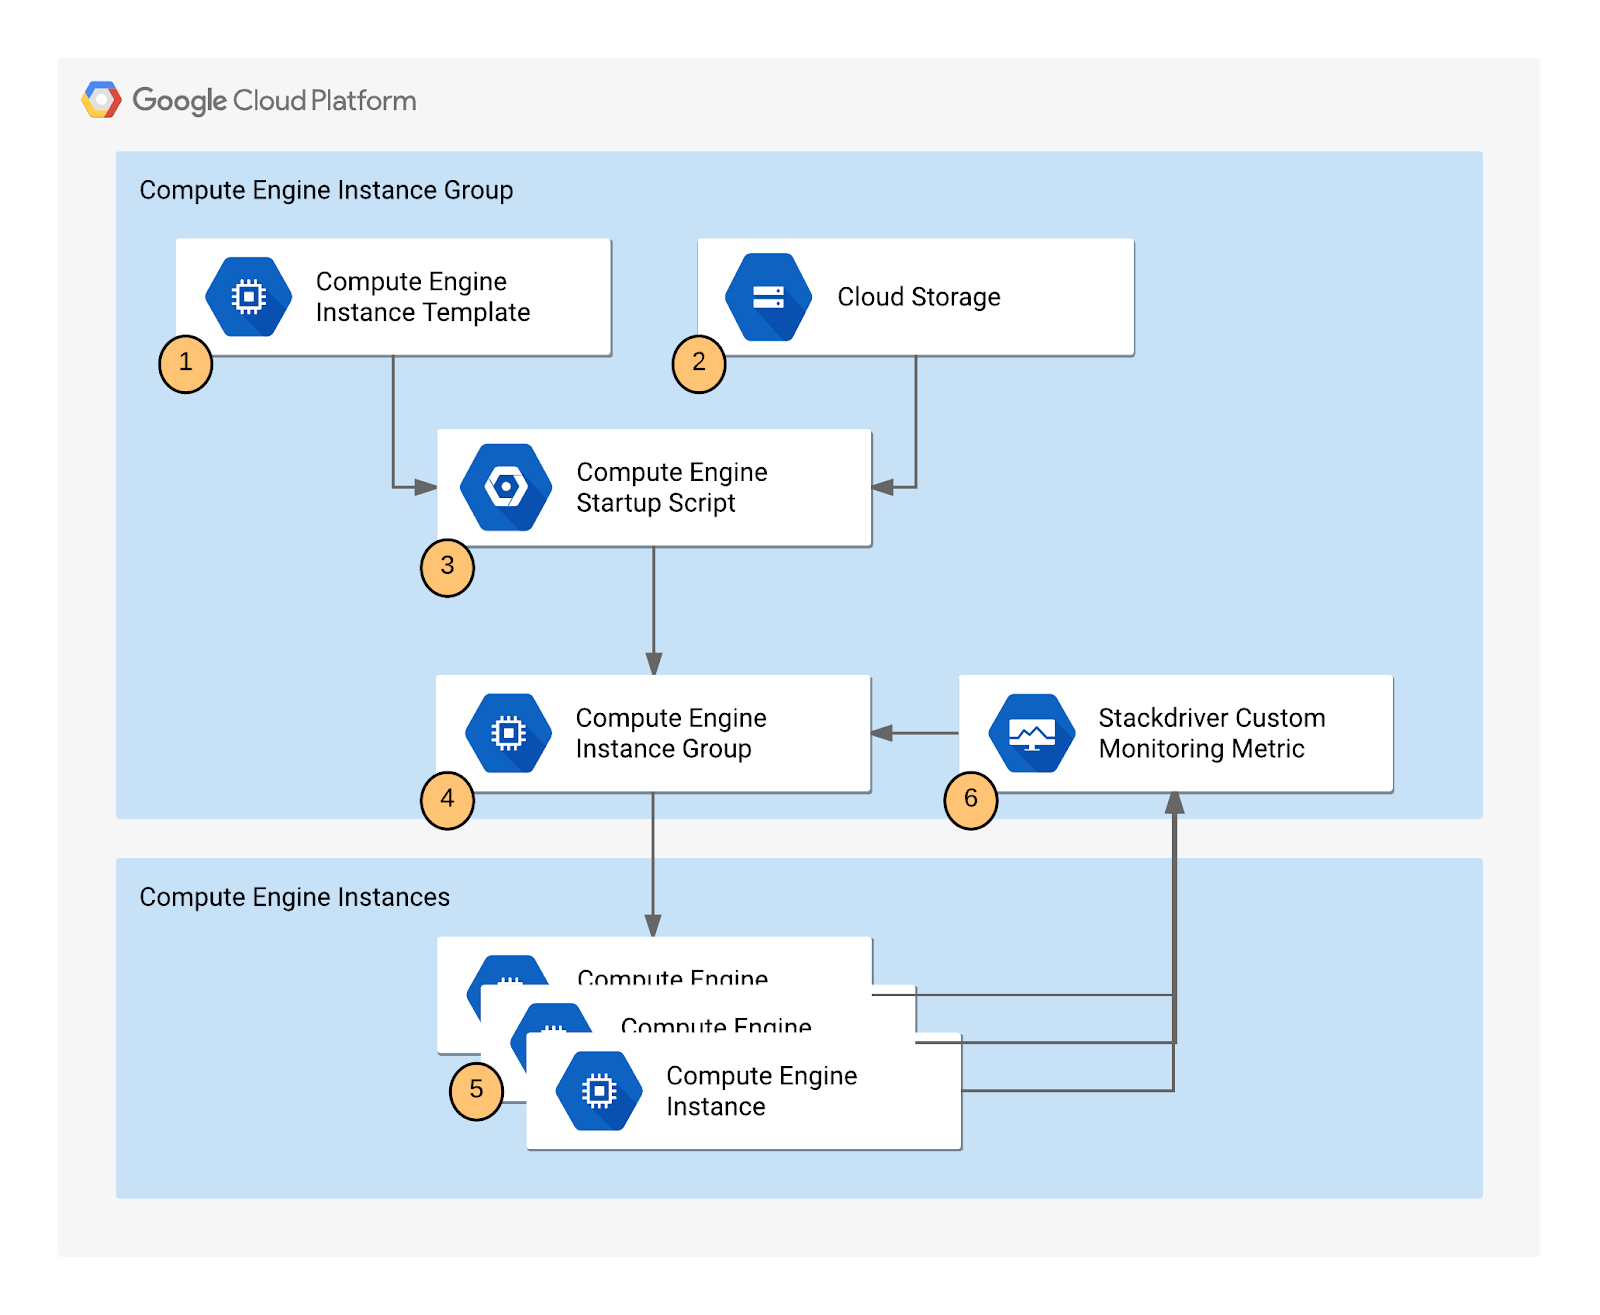
- If a VM instance fails or becomes unhealthy, the MIG automatically replaces it.
- During peak demand, the group scales out to handle the load, and during low demand the group scales in to save you money on compute resources to you don't need.
- By using a custom metric, you can scale based on factors unique to your application's internal health, not just basic CPU usage.
In this lab you implement a metrics-based autoscaling Managed Instance Group, then use Monitoring to confirm that your application is self-managing its capacity.
Objectives
In this lab, you will learn how to perform the following tasks:
- Deploy an autoscaling Compute Engine Managed Instance Group.
- Create a custom metric used to scale the instance group.
- Observe the system through Monitoring
Setup and requirements
Before you click the Start Lab button
Read these instructions. Labs are timed and you cannot pause them. The timer, which starts when you click Start Lab, shows how long Google Cloud resources are made available to you.
This hands-on lab lets you do the lab activities in a real cloud environment, not in a simulation or demo environment. It does so by giving you new, temporary credentials you use to sign in and access Google Cloud for the duration of the lab.
To complete this lab, you need:
- Access to a standard internet browser (Chrome browser recommended).
Note: Use an Incognito (recommended) or private browser window to run this lab. This prevents conflicts between your personal account and the student account, which may cause extra charges incurred to your personal account.
- Time to complete the lab—remember, once you start, you cannot pause a lab.
Note: Use only the student account for this lab. If you use a different Google Cloud account, you may incur charges to that account.
How to start your lab and sign in to the Google Cloud console
-
Click the Start Lab button. If you need to pay for the lab, a dialog opens for you to select your payment method.
On the right is the Lab setup and access panel with the following:
- The Open Google Cloud console button
- The temporary credentials (username and password) that you must use for this lab
- Other information, if needed, to step through this lab
Note that the lab timer is located near the top of the page, showing the remaining time.
-
Click Open Google Cloud console (or right-click and select Open Link in Incognito Window if you are running the Chrome browser).
The lab spins up resources, and then opens another tab that shows the Sign in page.
Tip: Arrange the tabs in separate windows, side-by-side.
Note: If you see the Choose an account dialog, click Use Another Account.
-
If necessary, copy the Username below and paste it into the Sign in dialog.
{{{user_0.username | "Username"}}}
You can also find the Username in the Lab setup and access panel.
-
Click Next.
-
Copy the Password below and paste it into the Welcome dialog.
{{{user_0.password | "Password"}}}
You can also find the Password in the Lab setup and access panel.
-
Click Next.
Important: You must use the credentials the lab provides you. Do not use your Google Cloud account credentials.
Note: Using your own Google Cloud account for this lab may incur extra charges.
-
Click through the subsequent pages:
- Accept the terms and conditions.
- Do not add recovery options or two-factor authentication (because this is a temporary account).
- Do not sign up for free trials.
After a few moments, the Google Cloud console opens in this tab.
Note: To access Google Cloud products and services, click the Navigation menu or type the service or product name in the Search field.

Activate Cloud Shell
Cloud Shell is a virtual machine that is loaded with development tools. It offers a persistent 5GB home directory and runs on the Google Cloud. Cloud Shell provides command-line access to your Google Cloud resources.
-
Click Activate Cloud Shell  at the top of the Google Cloud console.
-
Click through the following windows:
- Continue through the Cloud Shell information window.
- Authorize Cloud Shell to use your credentials to make Google Cloud API calls.
When you are connected, you are already authenticated, and the project is set to your Project_ID, . The output contains a line that declares the Project_ID for this session:
Your Cloud Platform project in this session is set to {{{project_0.project_id | "PROJECT_ID"}}}
gcloud is the command-line tool for Google Cloud. It comes pre-installed on Cloud Shell and supports tab-completion.
- (Optional) You can list the active account name with this command:
gcloud auth list
- Click Authorize.
Output:
ACTIVE: *
ACCOUNT: {{{user_0.username | "ACCOUNT"}}}
To set the active account, run:
$ gcloud config set account `ACCOUNT`
- (Optional) You can list the project ID with this command:
gcloud config list project
Output:
[core]
project = {{{project_0.project_id | "PROJECT_ID"}}}
Note: For full documentation of gcloud, in Google Cloud, refer to the gcloud CLI overview guide.
Creating the application
The instance template needs a way to install the necessary application and scripts on every new VM it creates. Cloud Storage acts as a stable, accessible source for the startup script (startup.sh), which will execute when a new instance launches.
You will make a copy of the startup script and application files for a sample application used by this lab that pushes a pattern of data into a custom metric that you can then use to configure as the metric that controls the autoscaling behavior.
Note: There is a pre-existing instance template and group that has been created automatically by the lab that is already running. Autoscaling requires at least 30 minutes to demonstrate both scale-up and scale-down behavior, and you will examine this group later to see how scaling is controlled by the variations in the custom metric values generated by the custom metric scripts.
Task 1. Create a bucket
-
In the Cloud console, from the Navigation menu select Cloud Storage > Buckets, then click Create.
-
Give your bucket a unique name, but don't use a name you might want to use in another project. For details about how to name a bucket, see the bucket naming guidelines. You can use your Project ID + "bucket" for the bucket name. This bucket will be referenced as YOUR_BUCKET throughout the lab.
-
Accept the default values then click Create.
-
Click Confirm for Public access will be prevented pop-up if prompted.
When the bucket is created, the Bucket details page opens.
Test completed task
Click Check my progress to verify your performed task. If you have successfully created a Cloud Storage bucket, you will see an assessment score.
Create a Cloud Storage bucket
- Next, run the following command in Cloud Shell to copy the startup script files from the lab default Cloud Storage bucket to your Cloud Storage bucket. Remember to replace
<YOUR BUCKET> with the name of the bucket you just made:
gsutil cp -r gs://spls/gsp087/* gs://<YOUR BUCKET>
- After you upload the scripts, click Refresh on the Bucket details page. Your bucket should list the added files.
Understanding the code components
-
Startup.sh - A shell script that installs the necessary components to each Compute Engine instance as the instance is added to the managed instance group.
-
writeToCustomMetric.js - A Node.js snippet that creates a custom monitoring metric whose value triggers scaling. In a production environment, this would be your actual application code, and the value it reports (appdemo_queue_depth_01) would be a critical business metric, such as: the number of pending messages in a queue, the number of open database connections, or the length of a batch processing backlog.
-
Config.json - A Node.js config file that specifies the values for the custom monitoring metric and used in writeToCustomMetric.js.
-
Package.json - A Node.js package file that specifies standard installation and dependencies for writeToCustomMetric.js.
-
writeToCustomMetric.sh - A shell script that continuously runs the writeToCustomMetric.js program on each Compute Engine instance.
Task 2. Creating an instance template
This is the blueprint for all VMs in the group. Autoscaling works by destroying and creating instances, and it must know exactly how to rebuild them. The template defines the machine type, OS image, and, most importantly, the metadata that points to the startup.sh script in your Cloud Storage bucket.
-
In the Cloud Console, click Navigation menu > Compute Engine > Instance templates.
-
Click Create Instance Template at the top of the page.
-
Name the instance template autoscaling-instance01.
-
Set Location as Global.
-
In the Machine configuration section, select E2 for the Machine family and e2-medium for the Machine type.
-
Scroll down, click Advanced options.
-
In the Metadata section of the Management tab, enter these metadata keys and values, clicking the + Add item button to add each one. Remember to substitute your bucket name for the [YOUR_BUCKET_NAME] placeholder:
| Key |
Value |
| startup-script-url |
gs://[YOUR_BUCKET_NAME]/startup.sh |
| gcs-bucket |
gs://[YOUR_BUCKET_NAME] |
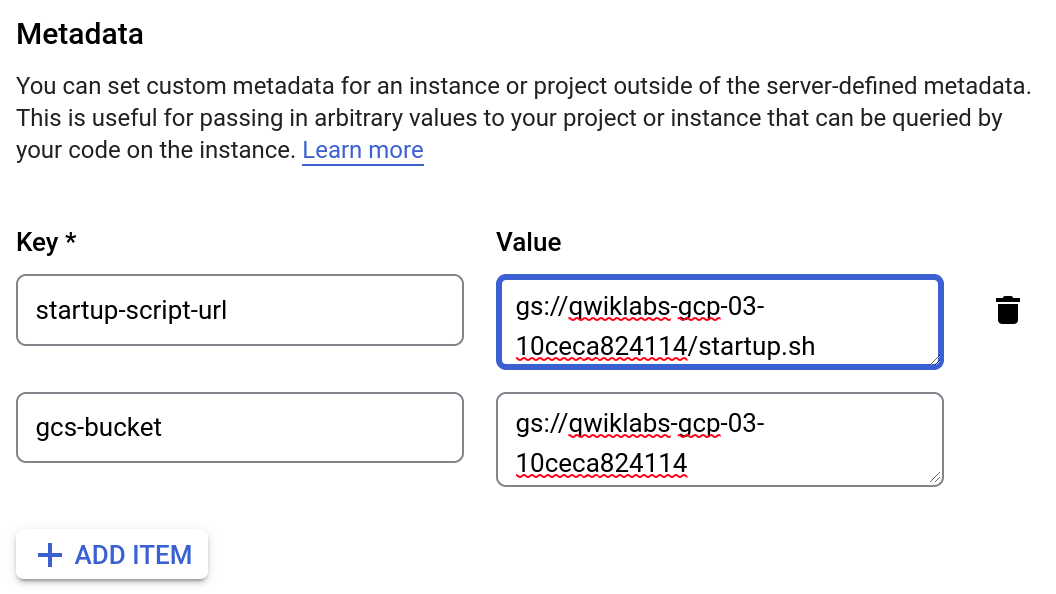
- Click Create.
Test completed task
Click Check my progress to verify your performed task. If you have successfully created an instance template, you will see an assessment score.
Create an instance template
Task 3. Creating the instance group
The instance group acts as the container and controller for the fleet of VMs. The Autoscaling mode is set to Off initially to control the environment and ensure the first instance is successfully running the custom metric script before enabling autoscaling.
-
In the left pane, click Instance groups.
-
Click Create instance group at the top of the page.
-
Name: autoscaling-instance-group-1.
-
For Instance template, select the instance template you just created.
-
For Location, select Single Zone and use and for the region and zone, respectively.
-
Set Autoscaling mode to Off: do not autoscale.
You'll edit the autoscaling setting after the instance group has been created. Leave the other settings at their default values.
- Click Create.
Note: You can ignore the Autoscaling is turned off. The number of instances in the group won't change automatically. The autoscaling configuration is preserved. warning next to your instance group.
Test completed task
Click Check my progress to verify your performed task. If you have successfully created an instance group, you will see an assessment score.
Create an instance group
Task 4. Verifying that the instance group has been created
Wait to see the green check mark next to the new instance group you just created. It might take the startup script several minutes to complete installation and begin reporting values.
You must confirm that the single test instance is successfully executing the writeToCustomMetric.js script and that the data is flowing into Cloud Monitoring. If the metric data isn't being reported, the autoscaler has nothing to react to. Checking the VM logs for nodeapp: available confirms this data pipeline is operational.
Click Refresh if it seems to be taking more than a few minutes.
Note: If you see a red icon next to the other instance group that was pre-created by the lab, you can ignore this warning. The instance group reports a warning for up to 10-15 minutes as it is initializing. This is expected behavior.
-
Still in the Instance Groups window, click the name of the autoscaling-instance-group-1 to display the instances that are running in the group.
-
Scroll down and click the instance name. Because autoscaling has not started additional instances, there is just a single instance running.
-
In the Details tab, in the Logs section, click the Logging link to view the logs for the VM instance.
-
Wait a minute or 2 to let some data accumulate. Enable the Show query toggle, you will see resource.type and resource.labels.instance_id in the Query preview box.
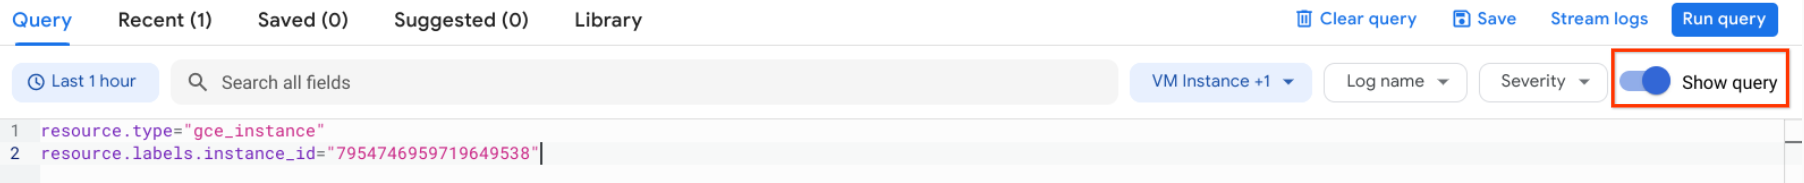
- Add
"nodeapp" as line 3, so the code looks similar to this:
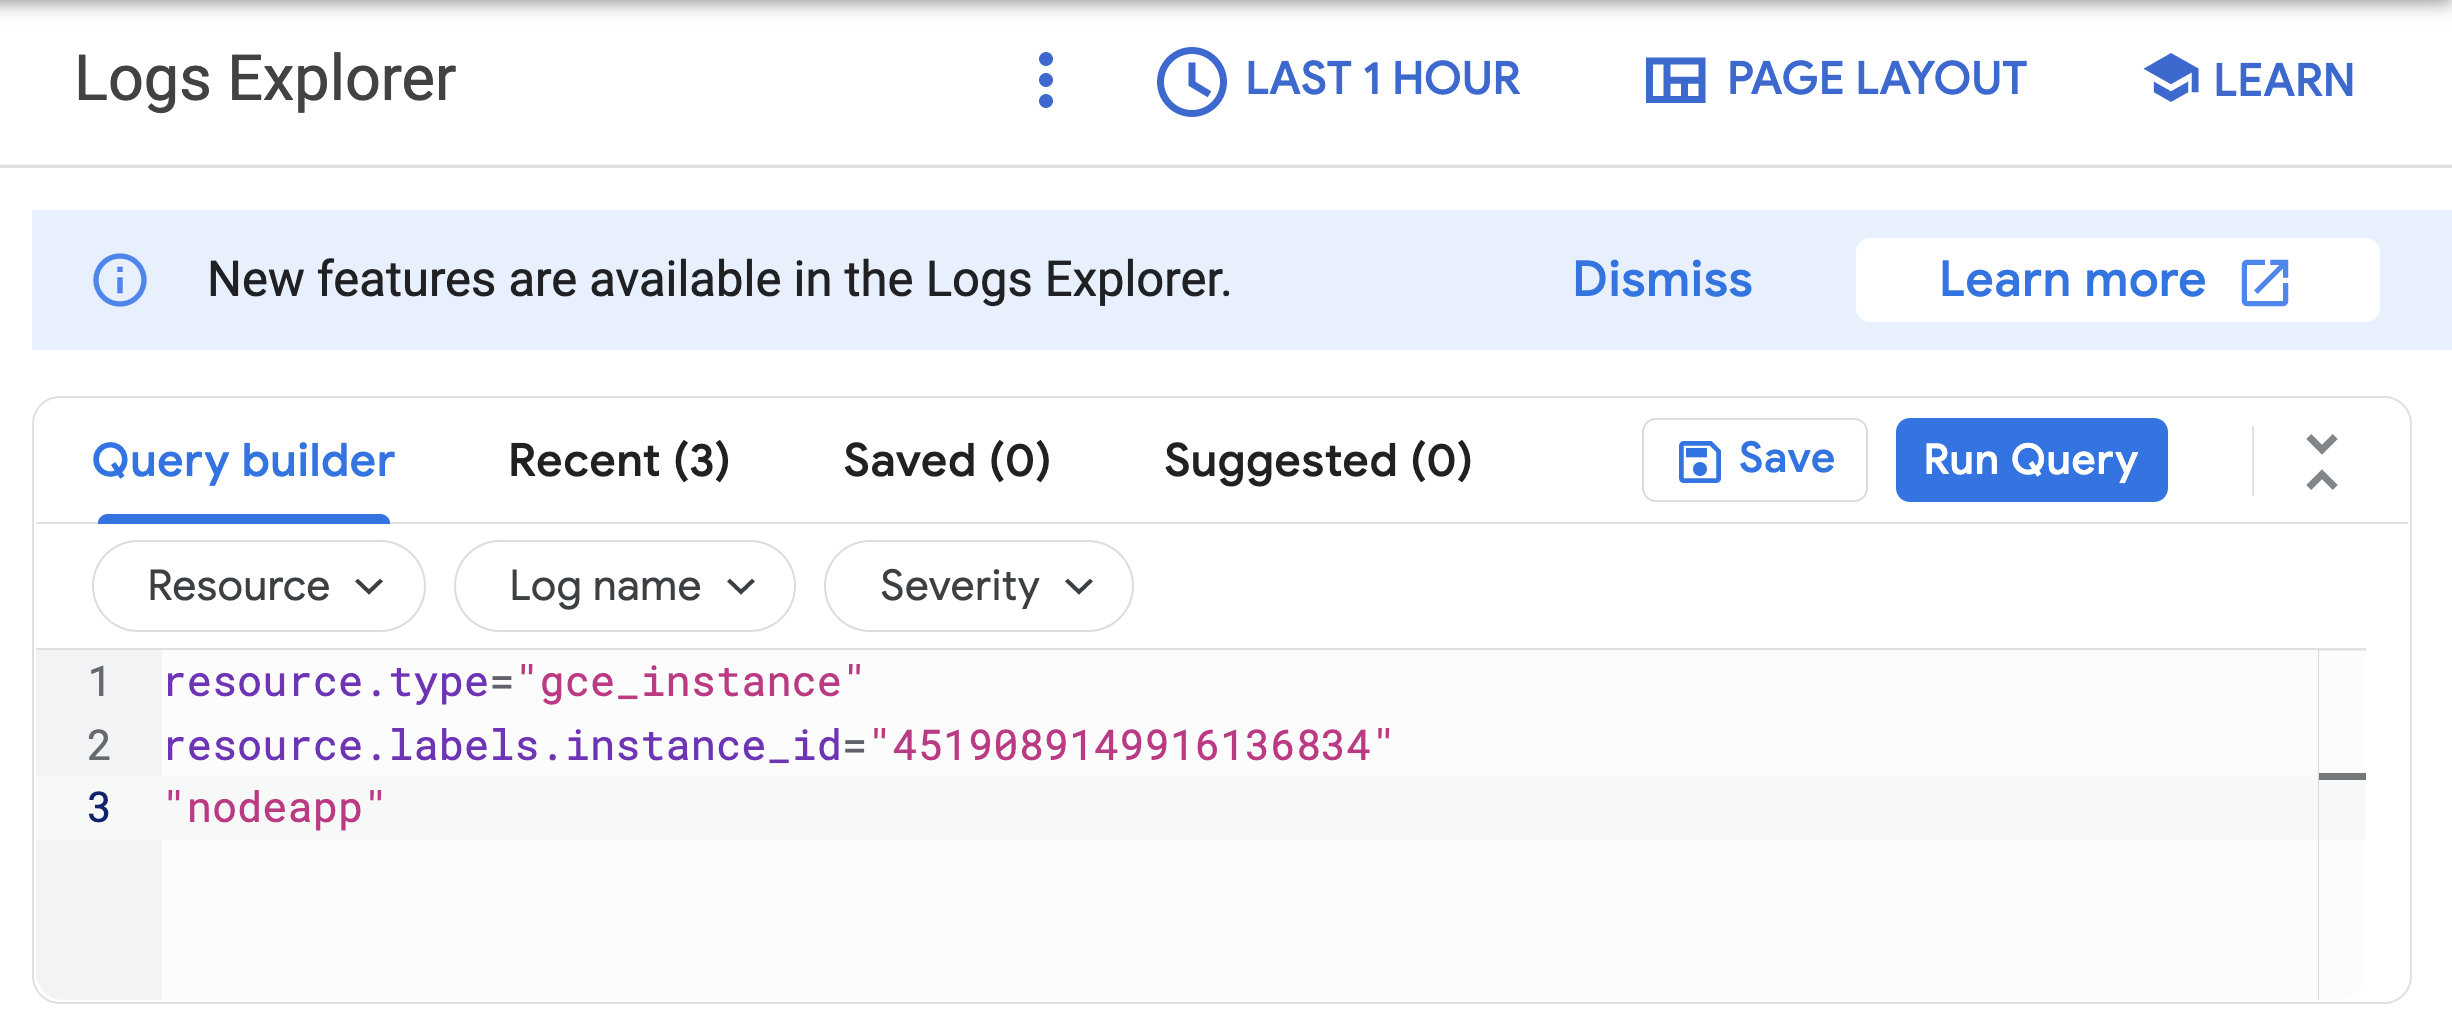
- Click Run query.
If the Node.js script is being executed on the Compute Engine instance, a request is sent to the API, and log entries that say nodeapp: available is displayed.
Note: If you don't see this log entry, the Node.js script isn't reporting the custom metric values. Check that the metadata was entered correctly. If the metadata is incorrect, it might be easiest to restart the lab. It may take around 10 minutes for the app to start up.
Task 6. Configure autoscaling for the instance groups
After you've verified that the custom metric is successfully reporting data from the first instance, the instance group can be configured to autoscale based on the value of the custom metric.
-
In the Cloud console, go to Compute Engine > Instance groups.
-
Click the autoscaling-instance-group-1 group.
-
Click Edit.
-
Under Autoscaling set Autoscaling mode to On: add and remove instances to the group.
-
Set Minimum number of instances: 1 and Maximum number of instances: 3
This defines the lower and upper bounds of your cost and performance guarantee. You pay for at least 1 instance, and you're guaranteed to never scale beyond 3 instances, which manages your cost exposure.
-
Under Autoscaling signals click Add a signal to edit metric. Set the following fields, leave all others at the default value.
-
Signal type:
Cloud Monitoring metric. Click Configure.
- Under Resource and metric click Select a metric and navigate to VM Instance > Custom metrics > Custom/appdemo_queue_depth_01.
- Click Apply.
-
Utilization target:
150
When custom monitoring metric values are higher or lower than the Target value, the autoscaler scales the managed instance group, increasing or decreasing the number of instances. The target value can be any double value, but for this lab, the value 150 was chosen because it matches the values being reported by the custom monitoring metric.
-
Utilization target type:
Gauge. Click Select.
GAUGE: Scales based on the average current value of the metric across all instances. (e.g., "The average queue depth is 200, which is over my target of 150, so I need another machine.") This is appropriate for metrics like queue depth or CPU utilization. (By contrast, setting Target mode to DELTA_PER_MINUTE or DELTA_PER_SECOND autoscales based on the observed rate of change rather than an average value.)
-
Click Save.
Note: After selecting Gauge, click the dropdown again and re-select Gauge. Sometimes this forces the UI to correctly register the value.
Test completed task
Click Check my progress to verify your performed task. If you have successfully configured autoscaling for the instance group, you will see an assessment score.
Configure autoscaling for the instance group
Task 7. Watching the instance group perform autoscaling
The Node.js script varies the custom metric values it reports from each instance over time. As the value of the metric goes up, the instance group scales up by adding VMs. If the value goes down, the instance group detects this and scales down by removing VMs. The script emulates a real-world metric whose value might similarly fluctuate up and down.
Next, watch how the instance group is scaling in response to the metric by clicking the Monitoring tab to view the Autoscaled size graph.
- In the left pane, click Instance groups.
- Click the
builtin-igm instance group in the list.
- Click the Monitoring tab.
- Enable Auto Refresh.
Since this group had a head start, you can see the autoscaling details about the instance group in the autoscaling graph. The autoscaler will take about five minutes to correctly recognize the custom metric and it can take up to 10-15 minutes for the script to generate sufficient data to trigger the autoscaling behavior.
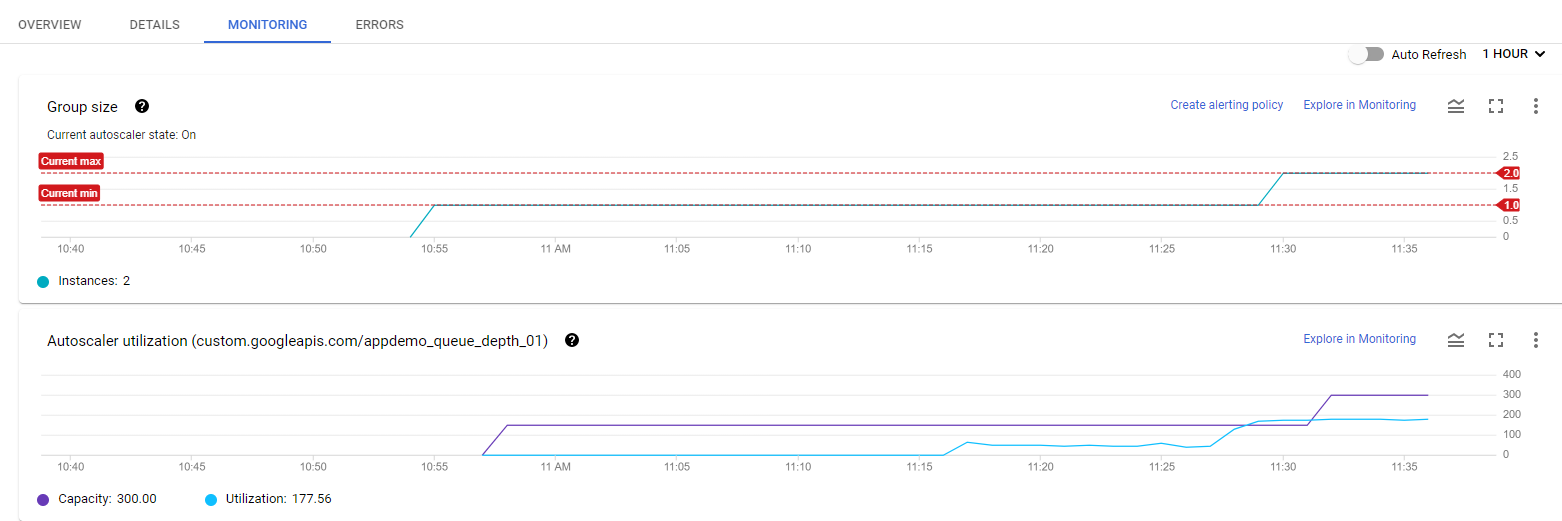
Mouse over the graphs to see more details.
You can switch back to the instance group that you created to see how it's doing (there may not be enough time left in the lab to see any autoscaling on your instance group).
For the remainder of the time in your lab, you can watch the autoscaling graph move up and down as instances are added and removed.
Task 8. Autoscaling example
Read through this autoscaling example to see how capacity and number of autoscaled instances can work in a larger environment.
The number of instances depicted in the top graph changes as a result of the varying aggregate level of the custom metric property values reported in the lower graph. There is a slight delay of up to five minutes after each instance starts up before that instance begins to report its custom metric values. While your autoscaling starts up, read through this graph to understand what will be happening:
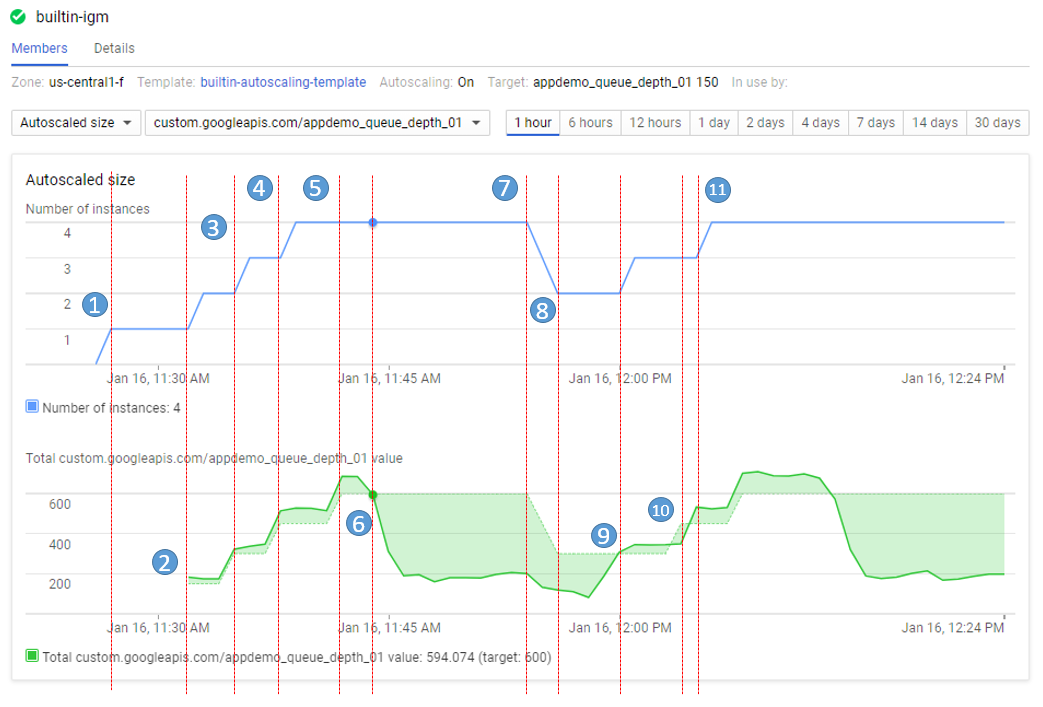
The script starts by generating high values for approximately 15 minutes in order to trigger scale-up behavior.
-
11:27 Autoscaling Group starts with a single instance. The aggregate custom metric target is 150.
-
11:31 Initial metric data acquired. As the metric is greater than the target of 150 the autoscaling group starts a second instance.
-
11:33 Custom metric data from the second instance starts to be acquired. The aggregate target is now 300. As the metric value is above 300 the autoscaling group starts the third instance.
-
11:37 Custom metric data from the third instance starts to be acquired. The aggregate target is now 450. As the cumulative metric value is above 450 the autoscaling group starts the fourth instance.
-
11:42 Custom metric data from the fourth instance starts to be acquired. The aggregate target is now 600. The cumulative metric value is now above the new target level of 600 but since the autoscaling group size limit has been reached no additional scale-up actions occur.
-
11:44 The application script has moved into a low metric 15 minute period. Even though the cumulative metric value is below the target of 600 scale-down must wait for a ten minute built-in scale-down delay to pass before making any changes.
-
11:54 Custom metric data has now been below the aggregate target level of 600 for a four node cluster for over 10 minutes. Scale-down now removes two instances in quick succession.
-
11:56 Custom metric data from the removed nodes is eliminated from the autoscaling calculation and the aggregate target is reduced to 300.
-
12:00 The application script has moved back into a high metric 15 minute period. The cumulative custom metric value has risen above the aggregate target level of 300 again so the autoscaling group starts a third instance.
-
12:03 Custom metric data from the new instance have been acquired but the cumulative values reported remain below the target of 450 so autoscaling makes no changes.
-
12:04 Cumulative custom metric values rise above the target of 450 so autoscaling starts the fourth instance.
Congratulations!
Congratulations! In this lab, you created a Compute Engine managed instance group that autoscales based on the value of a custom Cloud Monitoring metric. You also learned how to use the Cloud Console to visualize the custom metric and instance group size.
Next steps / Learn more
Google Cloud training and certification
...helps you make the most of Google Cloud technologies. Our classes include technical skills and best practices to help you get up to speed quickly and continue your learning journey. We offer fundamental to advanced level training, with on-demand, live, and virtual options to suit your busy schedule. Certifications help you validate and prove your skill and expertise in Google Cloud technologies.
Manual Last Updated on May 20, 2026
Lab Last Tested February 25, 2026
Copyright 2026 Google LLC. All rights reserved. Google and the Google logo are trademarks of Google LLC. All other company and product names may be trademarks of the respective companies with which they are associated.


