
准备工作
- 实验会创建一个 Google Cloud 项目和一些资源,供您使用限定的一段时间
- 实验有时间限制,并且没有暂停功能。如果您中途结束实验,则必须重新开始。
- 在屏幕左上角,点击开始实验即可开始
Pull all the billing data into your spreadsheet
/ 20
Refine your query
/ 10
Organize your spreadsheet
/ 20
Analyze your chart data
/ 20
Analyze your pivot table data
/ 20
Share with a link to the file
/ 10

As organizations grow in size and collect terabytes of complex data, they need tools to store and analyze their information. Each business unit may need to analyze a portion of that data for specific business needs. In Finance, for example, a financial controller may be interested in analyzing their Cloud Billing data to answer specific questions such as:
BigQuery helps users manage and analyze large datasets with high-speed compute power. But not everyone is a BigQuery expert or a data specialist. Many people may be more comfortable using spreadsheets to perform ad hoc data analysis. You can use Google Workspace Connected Sheets to pull your BigQuery data into Google Sheets and perform your analysis.
In this lab, you learn how to perform the following tasks:
For each lab, you get a new Google Cloud project and set of resources for a fixed time at no cost.
Sign in to Google Skills using an incognito window.
Note the lab's access time (for example, 1:15:00), and make sure you can finish within that time.
There is no pause feature. You can restart if needed, but you have to start at the beginning.
When ready, click Start lab.
Note your lab credentials (Username and Password). You will use them to sign in to the Google Cloud Console.
Click Open Google Console.
Click Use another account and copy/paste credentials for this lab into the prompts.
If you use other credentials, you'll receive errors or incur charges.
Accept the terms and skip the recovery resource page.
In this task, you use Google Workspace Connected Sheets to connect to BigQuery.
Open Google Sheets.
In the Welcome to Google Sheets dialog, click X.
3.To open a blank spreadsheet, in the Start a new spreadsheet pane, click Blank (
In this step you use Sheets to connect to BigQuery and access your billing data.
In the menu at the top, click Data > Data connectors > Connect to BigQuery.
In the Connect and analyze dialog, click Get connected.
In the Add data connection dialog, select the project name that starts with qwiklabs-gcp-xxxxx.
You're now ready to use the Sheets data connector to pull information from BigQuery.
To open the BigQuery query editor, click Write custom query.
In the BigQuery query editor, review the right pane. The Schema section shows your project details, which you need to create a query. In this example:
In this task, you use Google Workspace Connected Sheets to query your billing data (from the enterprise_billing table), and then pull the query results into your spreadsheet.
For more information about writing queries in BigQuery, refer to Syntax for SQL queries in BigQuery.
SELECT specifies columns. In this task, "*" (asterisk) selects all the columns.
FROM specifies where the data is pulled from, in the form [dataset].[table]; in this task, the data is pulled from billing_dataset.enterprise_billing.
A green check confirms that there are no errors in the script.
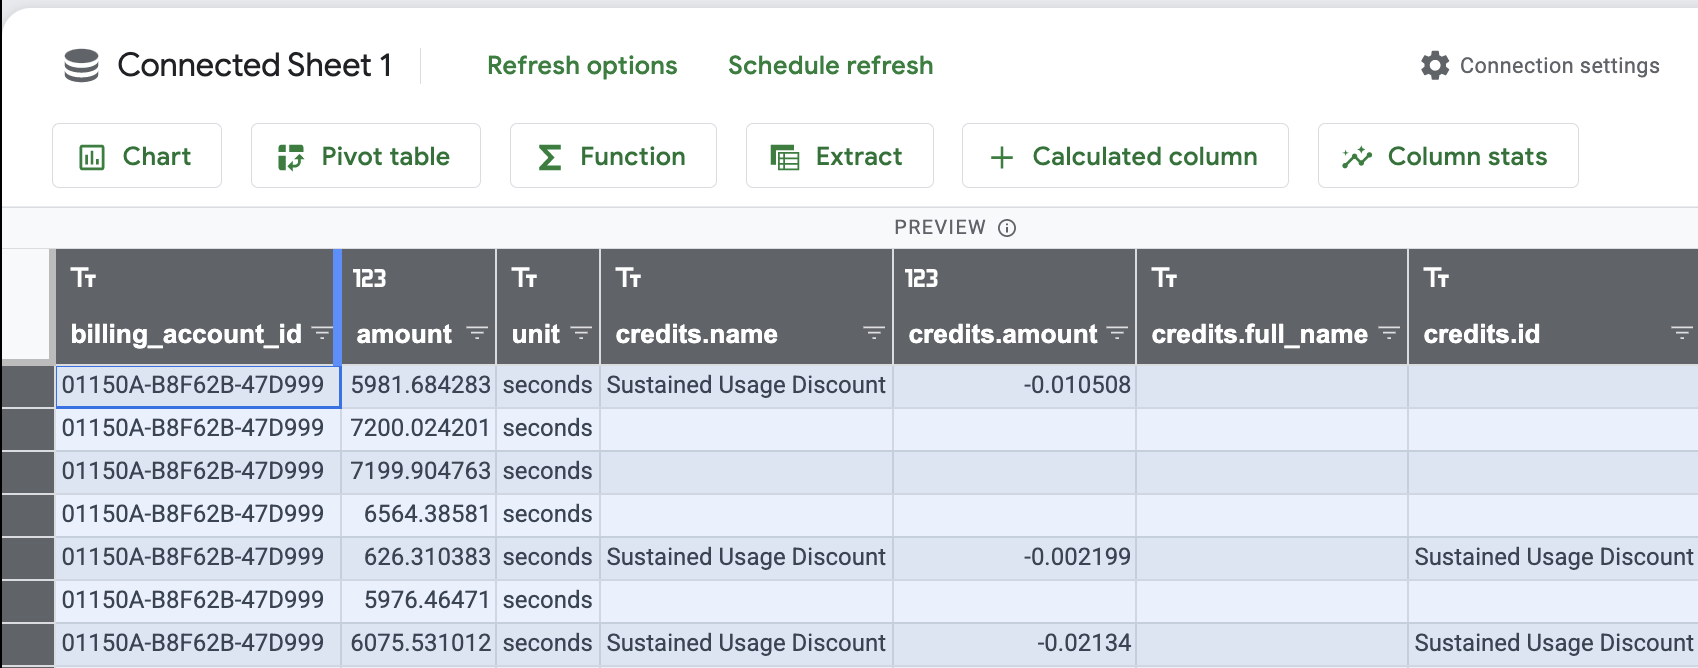
To see a sample of the returned data, click Preview results.
To pull the data into your Sheet, click Connect.
This creates the Connected Sheet 1 tab and pulls all the data into this tab.
In the Success dialog, click X.
You can use the Filter feature to organize and analyze the data. However, depending on what you want to analyze, it may be more efficient to pull over a subset of your data.
Click Check my progress to verify your performed task. If you have successfully run a query to pull all the billing data into your spreadsheet, you will receive an assessment score.
In the Preview of full data set pane, click More options (
The BigQuery editor opens.
In the BigQuery query editor, clear the current query, and type the following:
This query uses:
SELECT to specify the columnsWHERE to specify only data where the project.name is CTG - Dev or CTG - Prod and the service is Compute Engine for the month September 2020 to limit the number of rows in the sheet.ORDER BY to do exactly that: order the results by project.name
When the green check is displayed, click Connect.
Examine your updated spreadsheet to see what changed.
Click Check my progress to verify your performed task. If you have successfully refine your query and insert data into your spreadsheet, you will receive an assessment score.
In this task, you use some of the features of Sheets to organize and analyze your billing data.
In Google Sheets, click Untitled spreadsheet, and then rename the sheet to My Billing Report
Click Move (

In the New Folder dialog, type Billing Reports, click Create Folder (
To highlight all the rows and columns, click the upper left empty cell.
To resize the cell, click the right outside edge of the top cell of the first column, and then double-click.
The cell width changes to fit the text for each column.
Click Check my progress to verify your performed task.
In this task, you create tables and charts to analyze your data.
At the top, click Calculated column.
In the Add calculated column dialog, click Columns, and then select cost.
You may have to scroll down to see the cost option.
In the Enter name field, type Sum of Cost, and then click Add.
Click Apply.
Sum of Cost is added as a column to your spreadsheet.
At the top, click Chart, accept the defaults, and then click Create.
In Chart editor, in the Setup pane, do the following:
a. Click Add X-axis, and then select description.
b. Click Add Series, and then select Sum of Cost.
Click Apply.
A simple column chart is displayed.
To resize the chart, click the chart and drag out the corners.
In the chart, hover over the the different areas to see the pop-up descriptions.
Click the chart, click more (
Click Column chart, and then select Pie chart.
The display changes to a pie chart.
Click Check my progress to verify your performed task.
Return to the Connected Sheet 1 tab, and then click Pivot table.
In the Create pivot table dialog, accept the defaults, and then click Create.
In the Pivot table editor, do the following:
a. For Rows, click Add, and then select description.
b. For Columns, click Add, and then select name.
c. For Values, click Add, and then select Sum of Cost.
d. Click Apply.
To highlight all the rows and columns, click the upper-left empty cell.
To resize the cell, click the right outside edge of the top cell of the first column, and then double-click.
The cell width changes to fit the text for each column.
Click Check my progress to verify your performed task.
In this task, you periodically refresh your data to keep your spreadsheet current. When you refresh your data, all charts and pivot tables created within the spreadsheet are also refreshed.
To automatically refresh your data, record a macro, and then add a trigger to schedule it.
In Google Sheets, click Sheet1.
In the menu at the top, click Extensions > Macros > Record Macro.
The macro starts recording steps.
Click the Connected Sheet 1 tab, and then click Refresh preview.
In the macro dialog, click Save.
In the Name field, type Refresh Data, and then click Save.
In the menu at the top, click Extensions > Apps Script.
Apps Script opens in a new tab.
In the Recorded Macros window, in the left pane, click Triggers.
In the Welcome dialog, click View Dashboard.
In the Triggers window, click Add trigger.
The default trigger starts the macro when you open the spreadsheet. You update it to start the macro every 12 hours.
In the Add Trigger dialog, do the following:
a. Click Select event source, and then select Time-driven.
b. Click Select type of time based trigger, and then select Hour timer.
c. Click Select hour interval, and then select Every 12 hours.
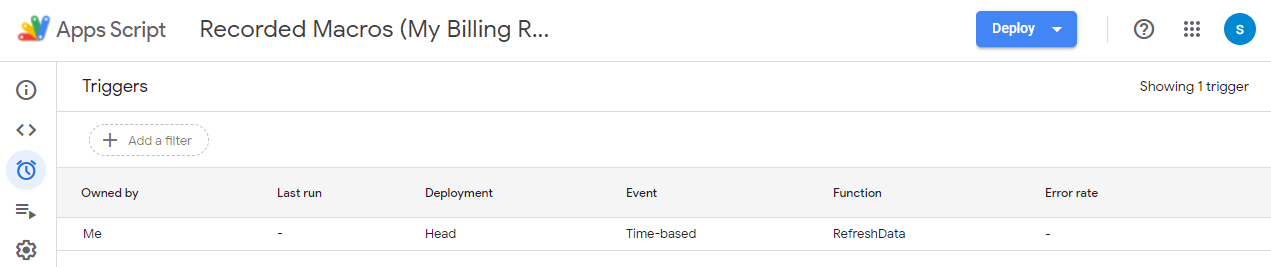
d. Click Save.
In the Choose an account dialog, click your lab Username to continue to Recorded Macros.
In the Access your Google account dialog, click Allow.
This allows your spreadsheet to view your data in BigQuery and view and manage spreadsheets that this application has been installed in.
View your trigger in the trigger list.
Now your spreadsheet will refresh the data from BigQuery every 12 hours.
In this task, you determine who can see and edit queries and results by setting access to the spreadsheet. You set access by sharing your Sheet.
Return to the Google Sheets tab.
In Google Sheets, click Share.
In the Share dialog, type an email address of the recipient that you want to share with the file with.
If you don't want to notify recipients that you are sharing the file, clear the Notify people checkbox. If you notify people, each email address you enter will be included in a notification email.
Click Send.
In this step you share a link to the file.
In Google Sheets, click Share.
Click Restricted, and then select Qwiklabs.
Click Viewer. See how the options change. Anyone in this group with the link can view, but can't change or share the file with others.
Click Commenter. Anyone in this group can make comments and suggestions, but can't change or share the file with others.
Click Editor. Anyone in this group can make changes, accept or reject suggestions, and share the file with others. This includes using Sheets data connector to query the source data.
Click Copy link.
Copy and paste the link into an email.
Click Done.
Click Check my progress to verify your performed task.
In this lab, you learned how to:
When you have completed your lab, click End Lab. Google Skills removes the resources you’ve used and cleans the account for you.
You will be given an opportunity to rate the lab experience. Select the applicable number of stars, type a comment, and then click Submit.
The number of stars indicates the following:
You can close the dialog box if you don't want to provide feedback.
For feedback, suggestions, or corrections, please use the Support tab.
Copyright 2026 Google LLC All rights reserved. Google and the Google logo are trademarks of Google LLC. All other company and product names may be trademarks of the respective companies with which they are associated.


此内容目前不可用
一旦可用,我们会通过电子邮件告知您

太好了!
一旦可用,我们会通过电子邮件告知您

一次一个实验
确认结束所有现有实验并开始此实验