


准备工作
- 实验会创建一个 Google Cloud 项目和一些资源,供您使用限定的一段时间
- 实验有时间限制,并且没有暂停功能。如果您中途结束实验,则必须重新开始。
- 在屏幕左上角,点击开始实验即可开始
Stage your Google Sheets workbook
/ 10
Extract BigQuery columns in connected sheets
/ 20
Filter BigQuery columns in connected sheets
/ 20

In this scenario, you are a data analyst with strong experience in Google Sheets but are new to BigQuery. You are employed with a solar energy company who is interested in identifying U.S. counties with the highest number of homeowners who can benefit from a new grant. The new United States (U.S.) federal grant is available to homeowners with homes built before 1960 and annual incomes below $60,000 USD. You know that the necessary data to identify these homeowners is in your company's BigQuery data warehouse and would like to analyze the BigQuery data in Google Sheets.
Fortunately, through the BigQuery data connector in Google Sheets, Connected Sheets provides you with the ability to access, analyze, visualize, and share BigQuery data without the need for any SQL.
In this lab, you learn how to get started with BigQuery data in Google Sheets by extracting and filtering BigQuery data in Connected Sheets.
In this lab, you will learn how to perform the following tasks:
In order to complete this lab exercise, you must have previous knowledge with and experience performing the following tasks:
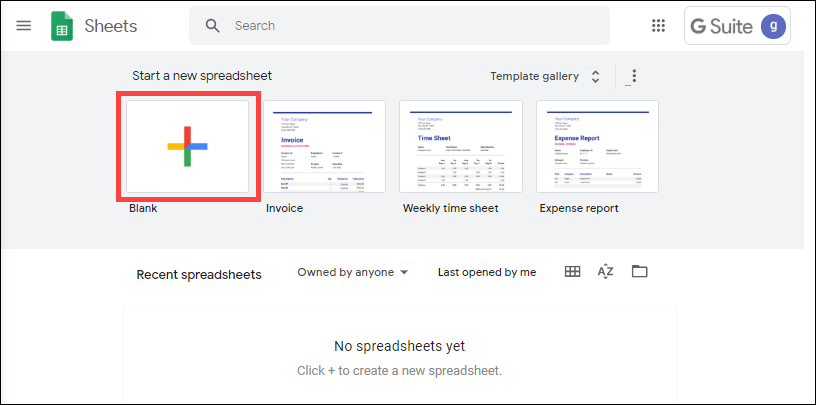
In this first task, you log into Google Workspace in this lab environment using the provided credentials and then open a new Google Sheet.
To open Sheets, right-click this provided link for Open Google Sheets, and select the option to open the link in a new incognito window.
To sign into Google Workspace, use the credentials (username and password) provided on the current lab page.
Be sure to:
You must properly stage your sheet before you can complete the tasks in this lab exercise. To begin, please perform the following steps:
Use BigQuery Connected Sheets to locate the censustract2018_5yr_top10000_housingunits data table, contained within the
Use BigQuery Connected Sheets to download the censustract2018_5yr_top10000_housingunits data table into Google Sheets.
Click Check my progress to verify the objective.
After pulling BigQuery data into Connected Sheets, you may find that you have more data columns than you actually need for your analysis. For example, from the 242 columns included in the 2018 U.S. Census Bureau data, you are only interested in specific housing details related to median income, owner occupancy, and structure age for U.S. counties and are not interested in other columns such as population breakdown by age.
In this task, you use the Extract option in Connected Sheets to select desired data columns and copy them to a new tab in Google Sheets.
In the Connected Sheets menu, click Extract.
For Insert to, select New sheet, and click Create.
In the Extract editor, identify the Columns section, and click Edit.
Select Select individual columns, and search for or scroll to geo_id.
Click geo_id to add the column to the extract.
Repeat steps 4-5 to add three additional columns to the extract:
Leave the Extract editor open, and proceed to the next step.
Click Check my progress to verify the objective.
In Connected Sheets, the Extract editor also provides options to filter data based on specific column values. For example, from the 10,000 rows included in the adapted 2018 U.S. Census Bureau data, you want to extract only the rows for U.S. counties that fulfill certain criteria based on median income or age of structures.
In this task, you add filters to your extraction to further refine the extracted data to only U.S. counties with both a median income less than $60,000 USD and a median build year for structures before 1960.
In the Extract editor, identify the Filters section, and click Add.
Search for or scroll to median_year_structure_built.
Click median_year_structure_built to add the column to the filter.
Click Showing all items.
For Filter by condition, select Less than or equal to.
For Value, enter 1960.
Click OK.
Repeat steps 1-7 to add a new filter for median_income is less than or equal to 60000.
Click Apply.
Click Check my progress to verify the objective.
You have successfully used the BigQuery data connector to extract and filter BigQuery data in Connected Sheets!
Last Tested Date September 23, 2024
Last Updated Date September 23, 2024
When you have completed your lab, click End Lab. Google Skills removes the resources you’ve used and cleans the account for you.
You will be given an opportunity to rate the lab experience. Select the applicable number of stars, type a comment, and then click Submit.
The number of stars indicates the following:
You can close the dialog box if you don't want to provide feedback.
For feedback, suggestions, or corrections, please use the Support tab.
Copyright 2026 Google LLC All rights reserved. Google and the Google logo are trademarks of Google LLC. All other company and product names may be trademarks of the respective companies with which they are associated.


此内容目前不可用
一旦可用,我们会通过电子邮件告知您

太好了!
一旦可用,我们会通过电子邮件告知您

一次一个实验
确认结束所有现有实验并开始此实验