Create a dataset

检查我的进度

/ 25

Load Data to BigQuery Tables

检查我的进度

/ 25

Explore and Investigate the Data with BigQuery

检查我的进度

/ 10

Prepare Your Data

检查我的进度

/ 10

Train an Unsupervised Model to Detect Anomalies

检查我的进度

/ 10

Train a Supervised Machine Learning Model

检查我的进度

/ 10

Predict Fraudulent Transactions on Test Data

检查我的进度

/ 10

此实验可能会提供 AI 工具来支持您学习。
此内容尚未针对移动设备进行优化。
为获得最佳体验,请在桌面设备上访问通过电子邮件发送的链接。

GSP774

Google Cloud self-paced labs

Overview

In this lab, you explore financial transactions data for fraud analysis, and apply feature engineering and machine learning techniques to detect fraudulent activities using BigQuery ML.

You use public financial transactions data that contains the following columns:

  • Type of the transaction
  • Amount transferred
  • Account ID of origin and destination
  • New and old balances
  • Relative time of transaction (number of hours from the start of the 30-day period)
  • isFraud flag

The target column isFraud includes the labels for the fraudulent transactions. Using these labels, you train supervised models for fraud detection and apply unsupervised models to detect anomalies.

The data for this lab is from the Kaggle site. If you do not have a Kaggle account, it's free to create one.

What you'll learn

In this lab, you learn how to perform the following tasks:

  • Load data into BigQuery and explore the dataset.
  • Create new features in BigQuery.
  • Build an unsupervised model for anomaly detection.
  • Build supervised models (with logistic regression and boosted tree) for fraud detection.
  • Evaluate and compare the models and select the champion model.
  • Use the selected model to predict the likelihood of fraud on test data.

In this lab, you use the BigQuery interface for feature engineering, model development, evaluation, and prediction.

Setup and requirements

Before you click the Start Lab button

Read these instructions. Labs are timed and you cannot pause them. The timer, which starts when you click Start Lab, shows how long Google Cloud resources are made available to you.

This hands-on lab lets you do the lab activities in a real cloud environment, not in a simulation or demo environment. It does so by giving you new, temporary credentials you use to sign in and access Google Cloud for the duration of the lab.

To complete this lab, you need:

  • Access to a standard internet browser (Chrome browser recommended).
Note: Use an Incognito (recommended) or private browser window to run this lab. This prevents conflicts between your personal account and the student account, which may cause extra charges incurred to your personal account.
  • Time to complete the lab—remember, once you start, you cannot pause a lab.
Note: Use only the student account for this lab. If you use a different Google Cloud account, you may incur charges to that account.

How to start your lab and sign in to the Google Cloud console

  1. Click the Start Lab button. If you need to pay for the lab, a dialog opens for you to select your payment method. On the right is the Lab setup and access panel with the following:

    • The Open Google Cloud console button
    • The temporary credentials (username and password) that you must use for this lab
    • Other information, if needed, to step through this lab

    Note that the lab timer is located near the top of the page, showing the remaining time.

  2. Click Open Google Cloud console (or right-click and select Open Link in Incognito Window if you are running the Chrome browser).

    The lab spins up resources, and then opens another tab that shows the Sign in page.

    Tip: Arrange the tabs in separate windows, side-by-side.

    Note: If you see the Choose an account dialog, click Use Another Account.
  3. If necessary, copy the Username below and paste it into the Sign in dialog.

    {{{user_0.username | "Username"}}}

    You can also find the Username in the Lab setup and access panel.

  4. Click Next.

  5. Copy the Password below and paste it into the Welcome dialog.

    {{{user_0.password | "Password"}}}

    You can also find the Password in the Lab setup and access panel.

  6. Click Next.

    Important: You must use the credentials the lab provides you. Do not use your Google Cloud account credentials. Note: Using your own Google Cloud account for this lab may incur extra charges.
  7. Click through the subsequent pages:

    • Accept the terms and conditions.
    • Do not add recovery options or two-factor authentication (because this is a temporary account).
    • Do not sign up for free trials.

After a few moments, the Google Cloud console opens in this tab.

Note: To access Google Cloud products and services, click the Navigation menu or type the service or product name in the Search field. Navigation menu icon and Search field

Activate Cloud Shell

Cloud Shell is a virtual machine that is loaded with development tools. It offers a persistent 5GB home directory and runs on the Google Cloud. Cloud Shell provides command-line access to your Google Cloud resources.

  1. Click Activate Cloud Shell Activate Cloud Shell icon at the top of the Google Cloud console.

  2. Click through the following windows:

    • Continue through the Cloud Shell information window.
    • Authorize Cloud Shell to use your credentials to make Google Cloud API calls.

When you are connected, you are already authenticated, and the project is set to your Project_ID, . The output contains a line that declares the Project_ID for this session:

Your Cloud Platform project in this session is set to {{{project_0.project_id | "PROJECT_ID"}}}

gcloud is the command-line tool for Google Cloud. It comes pre-installed on Cloud Shell and supports tab-completion.

  1. (Optional) You can list the active account name with this command:
gcloud auth list
  1. Click Authorize.

Output:

ACTIVE: * ACCOUNT: {{{user_0.username | "ACCOUNT"}}} To set the active account, run: $ gcloud config set account `ACCOUNT`
  1. (Optional) You can list the project ID with this command:
gcloud config list project

Output:

[core] project = {{{project_0.project_id | "PROJECT_ID"}}} Note: For full documentation of gcloud, in Google Cloud, refer to the gcloud CLI overview guide.

Task 1. Download the data file for the lab

  1. Run the following command to download the data file to your project:
gcloud storage cp gs://spls/gsp774/archive.zip .
  1. If prompted, click Authorize.
  1. After you download the zip file, run the unzip command:
unzip archive.zip

The command inflates 1 file.

  1. To make it easier to refer to this file later, create an environment variable for the name of the file:
export DATA_FILE=PS_20174392719_1491204439457_log.csv
  1. Run the following command to find the Project ID for your lab, and then copy the Project ID:
gcloud config list project
  1. Create an environment variable for the Project ID, replacing <project_id> with your copied Project ID:
export PROJECT_ID=<project_id>
  1. In Cloud Shell, run the following command to create a BigQuery dataset named finance to store tables and models for this lab:
bq mk --dataset $PROJECT_ID:finance

Successful execution of the command produces the following output:

Dataset `$PROJECT_ID:finance` successfully created.

Click Check my progress to verify the objective. Create a dataset

Task 2. Copy the dataset to Cloud Storage

  1. Run the following command to create a Cloud Storage bucket using your unique Project ID as its name:
gcloud storage buckets create gs://$PROJECT_ID
  1. Copy your CSV file into your newly created bucket:
gcloud storage cp $DATA_FILE gs://$PROJECT_ID

Task 3. Load data into BigQuery tables

To load your data into BigQuery, you can use either the BigQuery user interface or the terminal in Cloud Shell. Choose one of the following options to load your data.

Option 1: Command line

  • Load data into the table finance.fraud_data by running the following command:
bq load --autodetect --source_format=CSV --max_bad_records=100000 finance.fraud_data gs://$PROJECT_ID/$DATA_FILE

The --autodetect flag reads the schema of the table (such as variable names and types) automatically.

Option 2: BigQuery user interface

You can load data from your Cloud Storage bucket by opening BigQuery in the Google Cloud console.

  1. In the Data Explorer pane, click the Expand node arrow next to your Project ID.
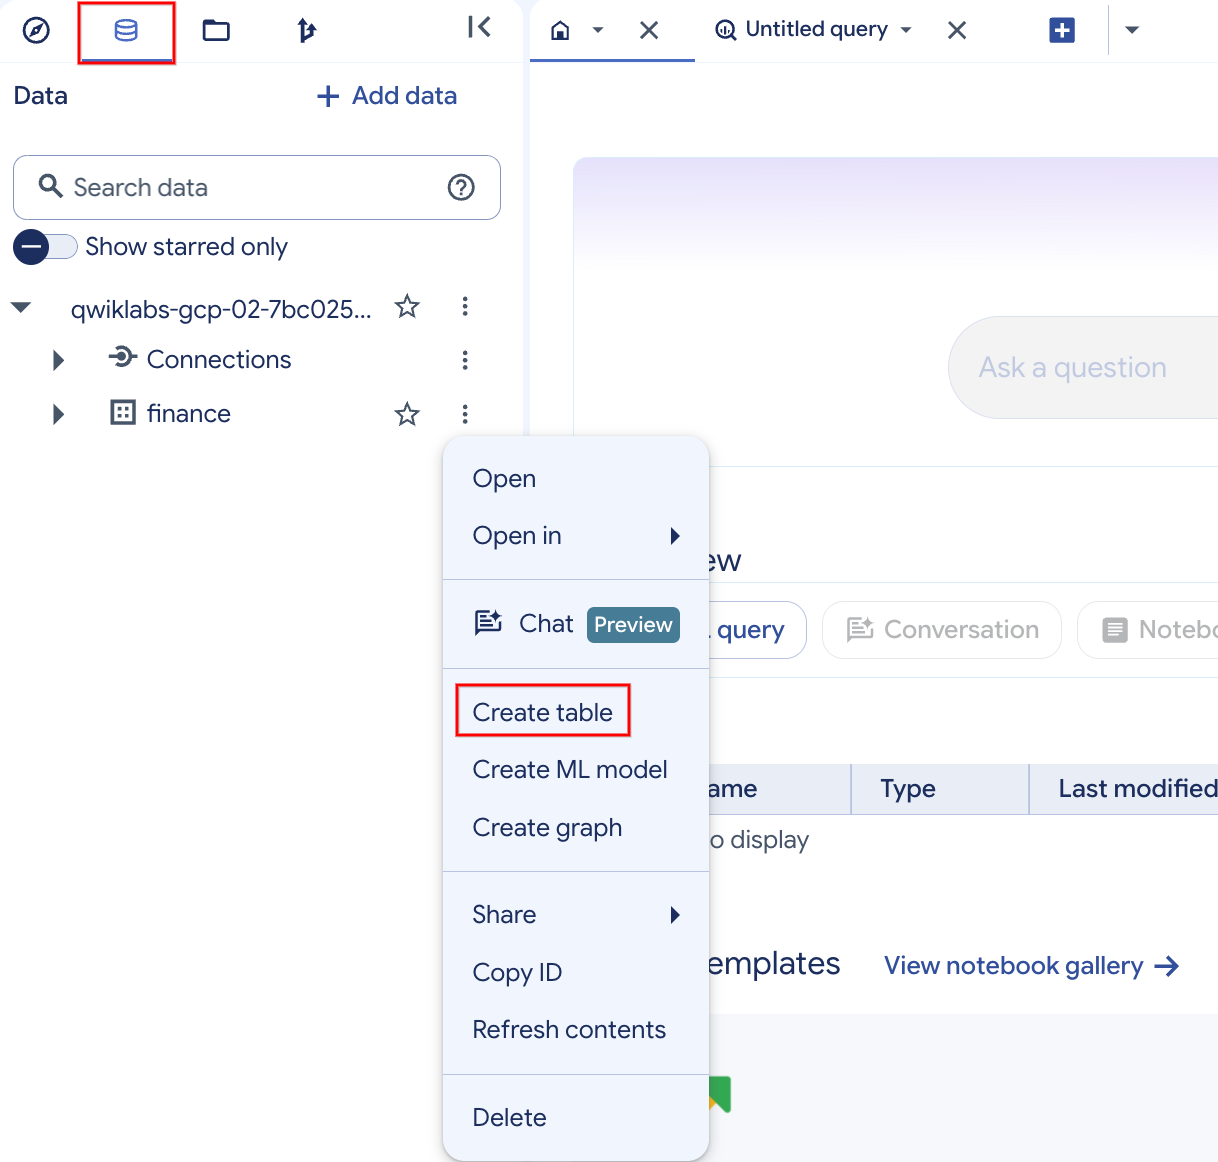
  2. Click View actions next to the finance dataset, and then click Create table.

Create table button highlighted

  1. In the Create table dialog, set Source to Google Cloud Storage and select the raw CSV file in your Cloud Storage bucket.
  2. For Table, enter fraud_data, and under Schema, select the Auto detect checkbox so that the variable names are read from the first line of the raw file automatically.
  3. Click Create table.

The loading process takes one or two minutes.

  1. After the table is created, in the Data Explorer pane in BigQuery, click the finance dataset and then click the fraud_data table to view the metadata and preview the table data.

Click Check my progress to verify the objective. Load Data to BigQuery Tables

Task 4. Explore and investigate the data with BigQuery

Next, you explore the data in BigQuery to understand it better and prepare it for machine learning models.

  1. If you haven't opened BigQuery in the Google Cloud console yet, click Navigation menu > BigQuery.

  2. In the query Editor, add the following query to check the number of fraudulent transactions for each transaction type, and then click Run:

SELECT type, isFraud, count(*) as cnt FROM `finance.fraud_data` GROUP BY isFraud, type ORDER BY type

Look in the isFraud column for 1 (yes).

  1. Click SQL query (+) to start a new query tab so that you can compare results easily, and then run the following query to view the proportion of fraudulent activities for the TRANSFER and CASH_OUT transaction types (the counts of isFraud):
SELECT isFraud, count(*) as cnt FROM `finance.fraud_data` WHERE type in ("CASH_OUT", "TRANSFER") GROUP BY isFraud
  1. Click SQL query (+) and run the following query to view the top 10 maximum transaction amounts:
SELECT * FROM `finance.fraud_data` ORDER BY amount desc LIMIT 10

Pause and reflect:

  • Have you noticed any interesting balance amounts in the transactions? How can you make a transaction when the balance in the origin account is zero? Why does the new balance in the destination account stay zero after the money transfer? You flag these cases and add them as new features in the next task.
  • Do you think the data is imbalanced? Yes, the proportion of fraudulent transactions is much less than 1%. When you divide the isFraud count by the total number of observations, you get the proportion of fraudulent transactions.

In the next task, you address these questions and improve the data for machine learning models.

Click Check my progress to verify the objective. Explore and Investigate the Data with BigQuery

Task 5. Prepare your data

You can improve the modeling data by adding new features, filtering unnecessary transaction types, and increasing the proportion of the target variable isFraud by applying undersampling.

Based on your findings from the analysis phase, you only need to analyze the transaction types "TRANSFER" and "CASH_OUT" and filter the rest. You can also compute new variables from the existing amount values.

The dataset contains an extremely unbalanced target for fraud (fraud rate in the raw data = 0.0013%). Having rare events is common for fraud. To make the pattern of fraudulent behavior more obvious for the machine learning algorithms and make it easier to interpret the results, stratify the data and increase the proportion of the fraudulent flags.

  1. Compose a new query and run the following SQL statement to add new features to the data, filter unnecessary transaction types, and select a subset of the non-fraud transactions with undersampling:
CREATE OR REPLACE TABLE finance.fraud_data_sample AS SELECT type, amount, nameOrig, nameDest, oldbalanceOrg as oldbalanceOrig, #standardize the naming. newbalanceOrig, oldbalanceDest, newbalanceDest, # add new features: if(oldbalanceOrg = 0.0, 1, 0) as origzeroFlag, if(newbalanceDest = 0.0, 1, 0) as destzeroFlag, round((newbalanceDest-oldbalanceDest-amount)) as amountError, generate_uuid() as id, #create a unique id for each transaction. isFraud FROM finance.fraud_data WHERE # filter unnecessary transaction types: type in("CASH_OUT","TRANSFER") AND # undersample: (isFraud = 1 or (RAND()< 10/100)) # select 10% of the non-fraud cases
  1. Run the following query to create a fraud_data_test table by selecting a random sample of 20%:
CREATE OR REPLACE TABLE finance.fraud_data_test AS SELECT * FROM finance.fraud_data_sample where RAND() < 20/100

This test data is kept separate and is not included in training. You use it for scoring the model in the final task.

BigQuery ML and AutoML automatically partition the model data into TRAIN and VALIDATE splits while training machine learning algorithms to test the error rate on both the training and validation data and avoid overfitting.

  1. Run the following query to create the sample modeling data (fraud_data_model):
CREATE OR REPLACE TABLE finance.fraud_data_model AS SELECT * FROM finance.fraud_data_sample EXCEPT distinct select * from finance.fraud_data_test

The sample data that you created for modeling contains approximately 228,000 rows of banking transactions.

You can also manually partition your dataset into TRAIN, VALIDATE, and TEST splits, especially when you want to compare models from different environments such as Vertex AI and maintain consistency.

Pause and reflect:

  • How would you approach this problem if there were no labeled fraud events in the data? If there are no labeled transactions, you can use unsupervised modeling techniques such as k-means clustering to analyze anomalies in the data. In the next task, you try this method yourself.

Click Check my progress to verify the objective. Prepare Your Data

Task 6. Train an unsupervised model to detect anomalies

Unsupervised methods are commonly used in fraud detection to explore abnormal behavior in the data. They also help when there are no labels for fraud or when the event rate is very low and the number of occurrences does not allow you to build a supervised model.

In this task, you use the k-means clustering algorithm to create segments of transactions, analyze each segment, and detect the segments with anomalies.

  1. Create a new SQL query and run the following statement in BigQuery with CREATE OR REPLACE MODEL and model_type set to kmeans:
CREATE OR REPLACE MODEL finance.model_unsupervised OPTIONS(model_type='kmeans', num_clusters=5) AS SELECT amount, oldbalanceOrig, newbalanceOrig, oldbalanceDest, newbalanceDest, type, origzeroFlag, destzeroFlag, amountError FROM `finance.fraud_data_model`

This statement creates a k-means model named model_unsupervised with 5 clusters using the selected variables from fraud_data_model.

Note: It takes a few minutes for the model to finish training.

After the model finishes training, it appears under finance > Models.

  1. Click model_unsupervised, and then click the Evaluation tab.

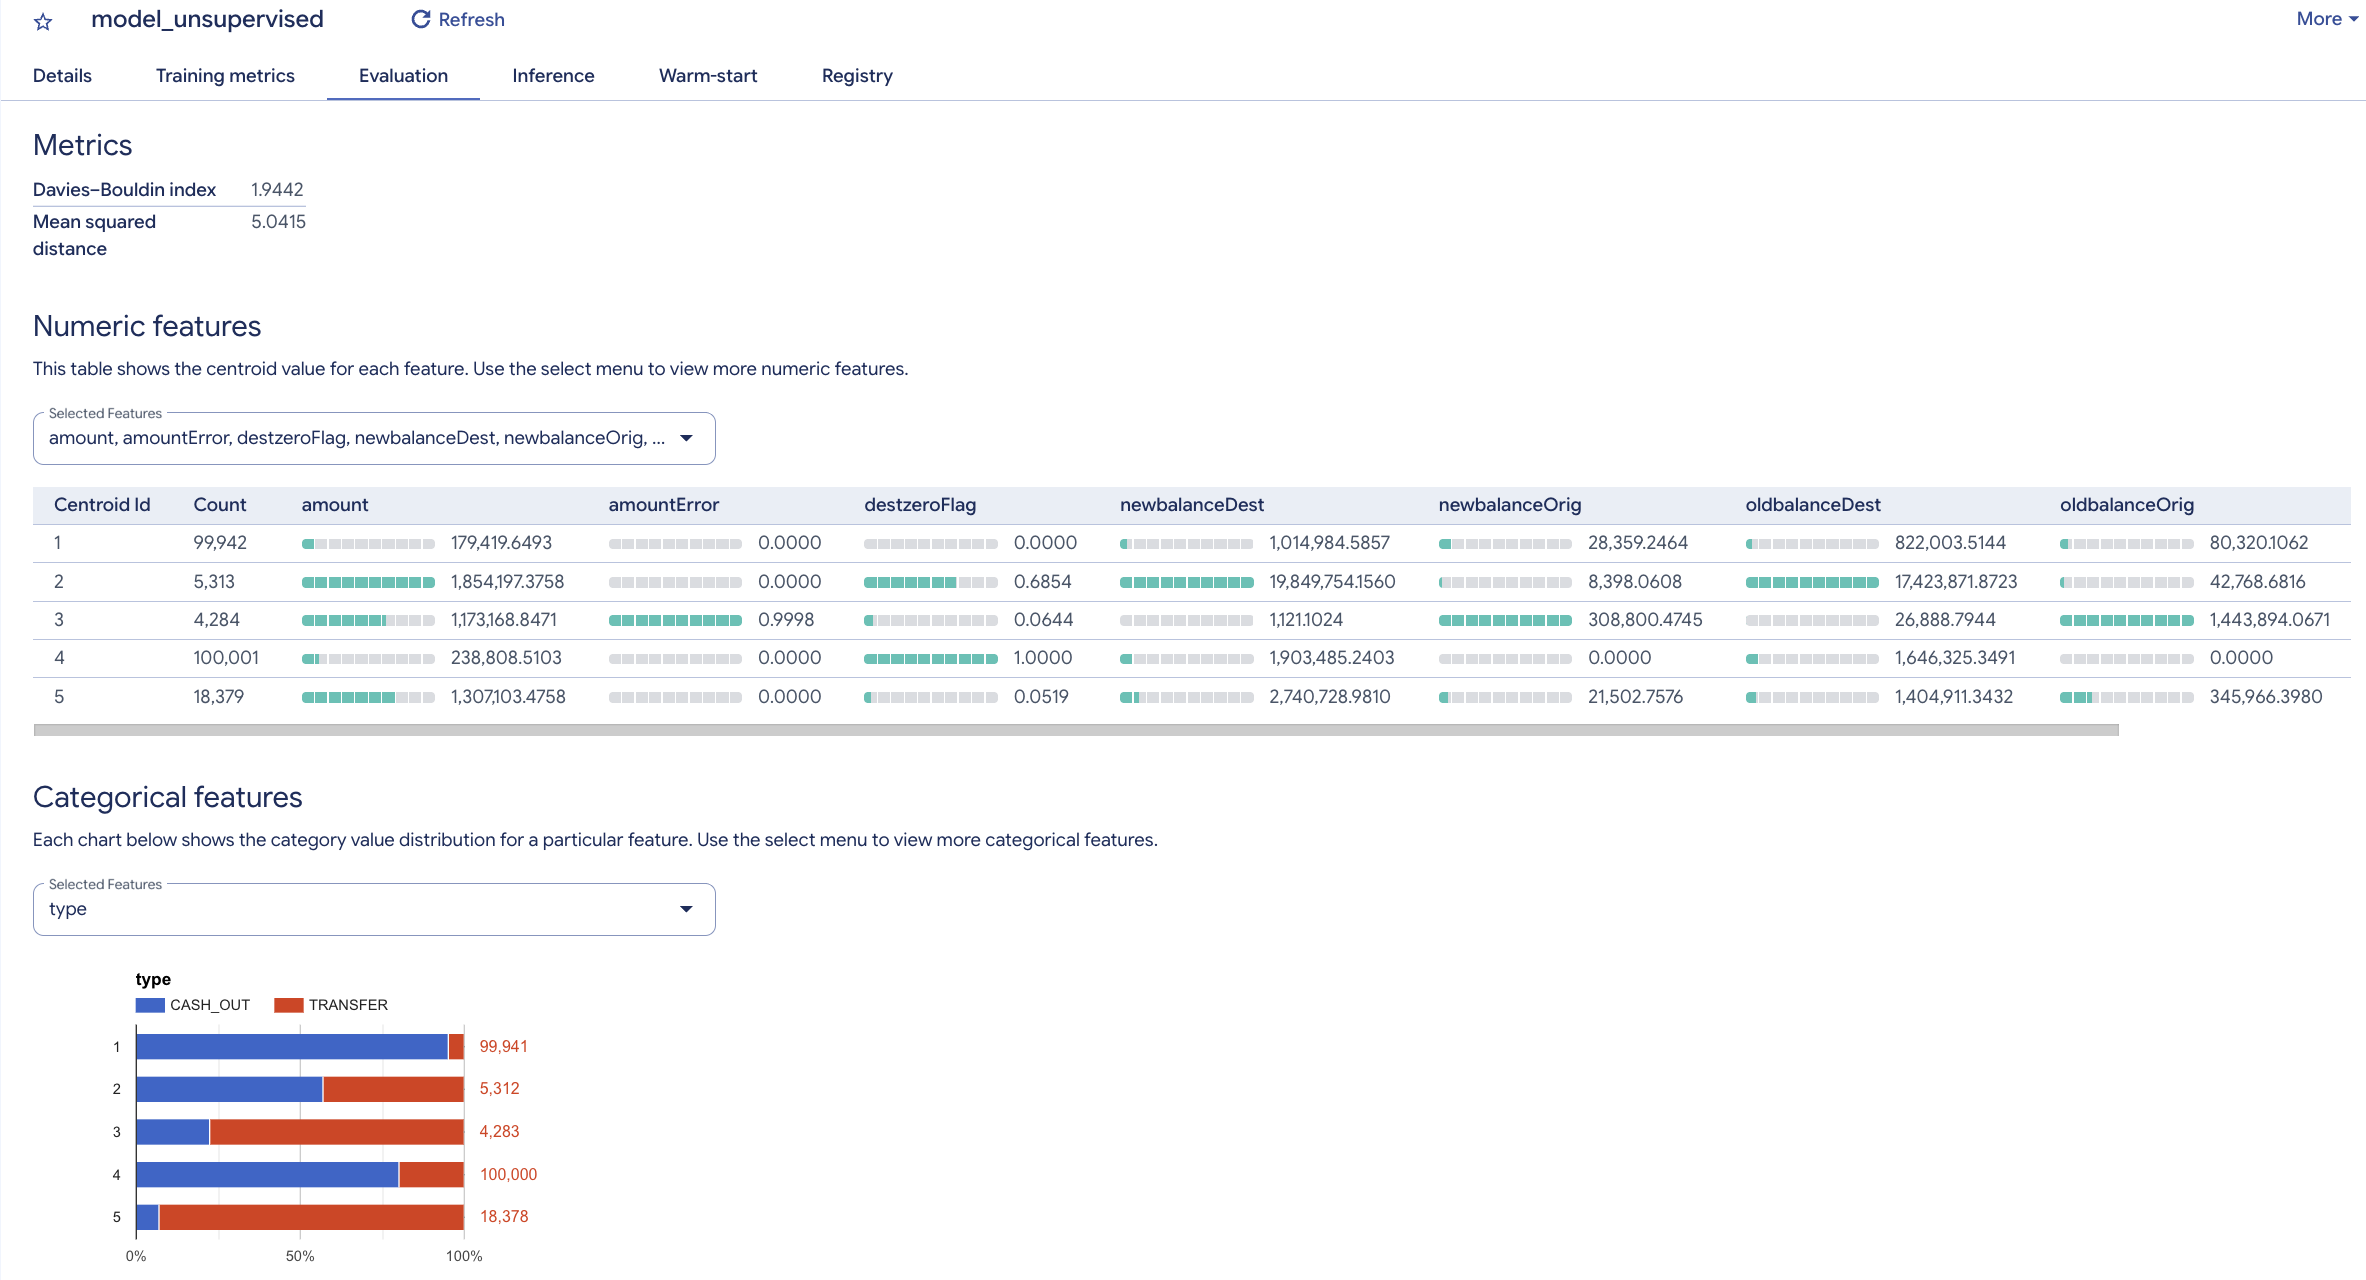
The k-means algorithm creates an output variable named centroid_id. Each transaction is assigned to a centroid_id. The transactions that are similar or closer to each other are assigned to the same cluster by the algorithm.

The Davies-Bouldin index indicates how homogeneous the clusters are. The lower the value is, the more distant the clusters are from each other, which is the desired outcome.

The numeric features are displayed with bar charts for each centroid (cluster) on the Evaluation tab. The numbers next to the bars show the average value of the variables within each cluster. As a best practice, the input variables can be standardized or grouped into buckets to avoid the impact of large numbers or outliers in the distance calculations for clustering. For simplicity, this lab uses the original variables.

The categorical variables that are used as input are displayed separately, showing the distribution of TRANSFER and CASH_OUT transactions in each segment.

The charts might look different for your model; focus on the smaller segments and interpret the distributions.

Evaluation tabbed page displaying Metrics, Numeric features, and Categorical features sections

The target variable isFraud hasn't been used in this unsupervised model. Instead, you can save that variable for profiling and use it to explore the distribution of fraudulent activities within each cluster.

The clustering algorithms create homogeneous groups of observations. You can score the test data (fraud_data_test) using ML.PREDICT to call the model and generate the centroid_id for each transaction in the test data.

  1. Run the following query in a new query tab to check the number of fraud events in each centroid_id:
SELECT centroid_id, sum(isfraud) as fraud_cnt, count(*) total_cnt FROM ML.PREDICT(MODEL `finance.model_unsupervised`, ( SELECT * FROM `finance.fraud_data_test`)) group by centroid_id order by centroid_id

Pause and reflect:

  • Which cluster do you think is the most interesting one? Look for the small clusters with high error amounts.

Click Check my progress to verify the objective. Train an Unsupervised Model to Detect Anomalies

Task 7. Train a supervised machine learning model

Now you are ready to build supervised models using BigQuery ML to predict the likelihood of fraudulent transactions. Start with a simple model by using BigQuery ML to create a binary logistic regression model for classification. This model predicts whether a transaction is likely to be fraudulent.

For all non-numeric (categorical) variables, BigQuery ML automatically performs a one-hot encoding transformation. This transformation generates a separate feature for each unique value in the variable. In this task, BigQuery ML performs one-hot encoding for the type variable automatically.

  1. To create your first supervised model, run the following SQL statement in BigQuery:
CREATE OR REPLACE MODEL finance.model_supervised_initial OPTIONS(model_type='LOGISTIC_REG', INPUT_LABEL_COLS = ["isfraud"] ) AS SELECT type, amount, oldbalanceOrig, newbalanceOrig, oldbalanceDest, newbalanceDest, isFraud FROM finance.fraud_data_model Note: It takes a few minutes for BigQuery to create and train this logistic regression model.

When it is ready, model_supervised_initial appears under finance > Models.

After the model is created, you can view the model metadata, training, and evaluation statistics in the BigQuery console.

  1. In the Data Explorer pane, click model_supervised_initial, and then click the Details, Training, Evaluation, or Schema tab to view more information.

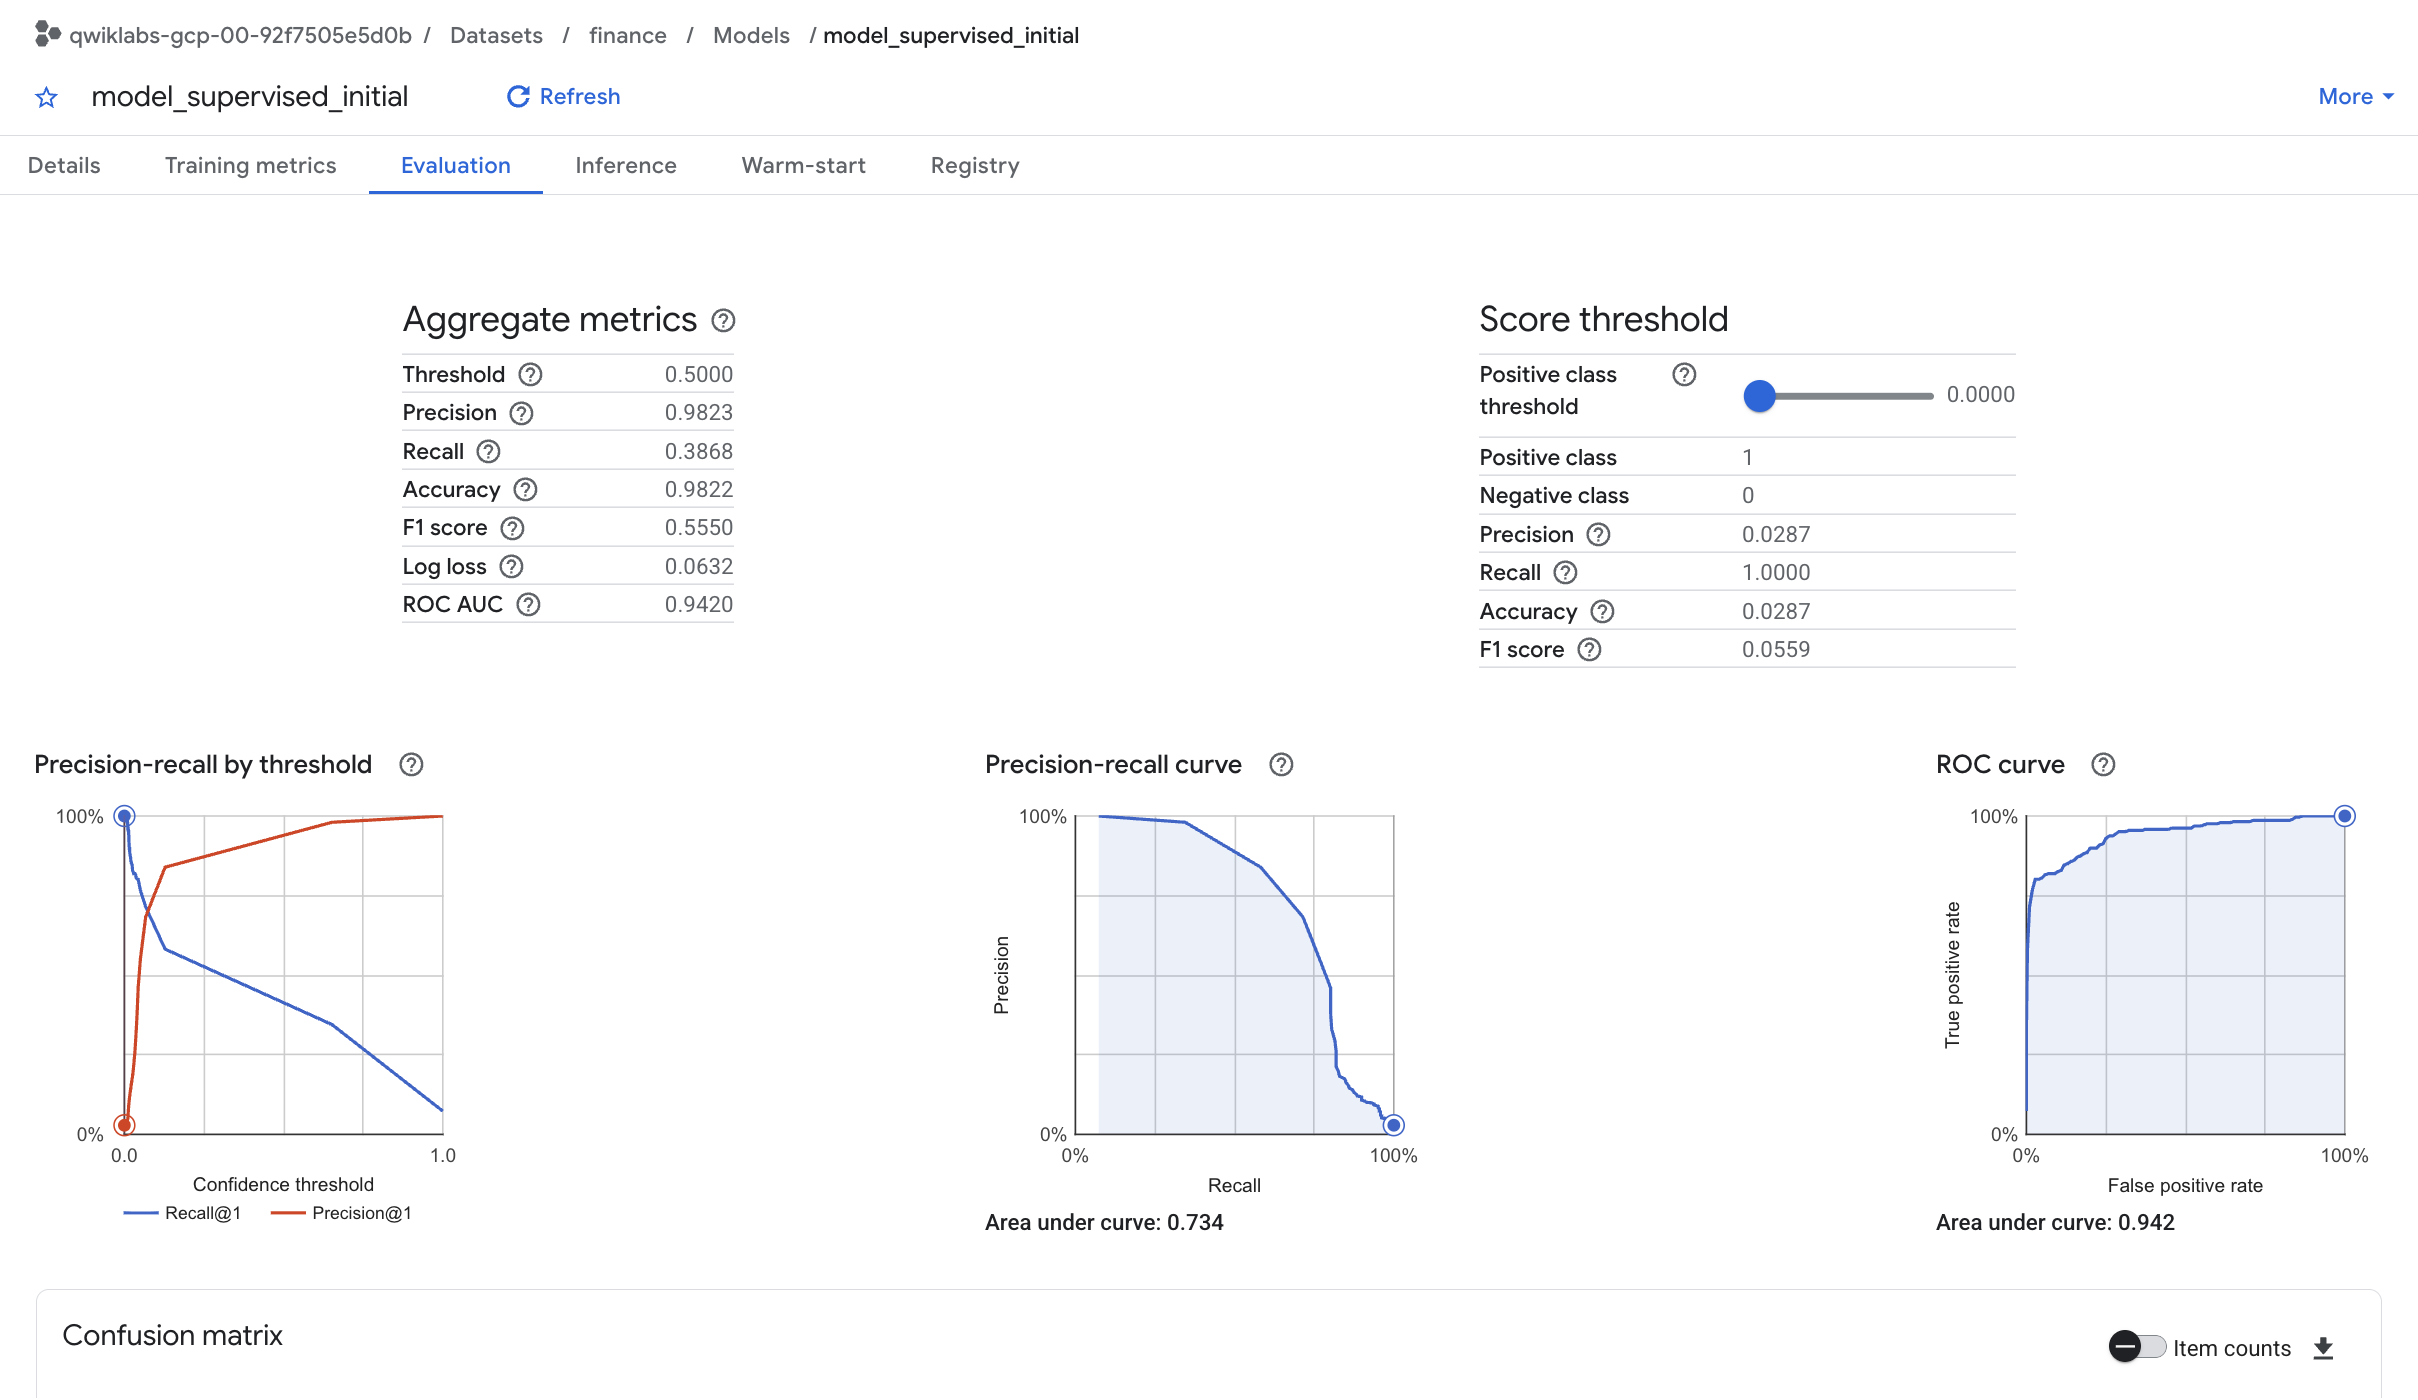
On the Evaluation tab, you find performance metrics specific to the classification model.

Evaluation tabbed page displaying sections: Aggregate metrics, Score threshold, Confusion matrix, and graphs

Understanding the performance of the model is a key topic in machine learning. Because you performed a logistic regression for classification, the following key concepts are useful to understand:

  • Precision: Identifies the proportion of selected positive cases where the model was correct.
  • Recall: Answers the question: Out of all the possible positive actual labels, how many did the model correctly identify?
  • Accuracy: Measures the overall proportion of correct predictions.
  • F1 score: Measures the accuracy of the model. The F1 score is the harmonic average of precision and recall, taking values from 0 to 1 (higher is better).
  • ROC and AUC: Measures the area under the ROC curve. This metric provides information about the discrimination capability of a binary classifier across different thresholds, taking values between 0 and 1 (higher is better). For a moderate model, the expectation is an ROC AUC value greater than 0.7.

The Precision and recall page on Wikipedia illustrates the concepts of precision and recall.

The ROC AUC value for this regression model is very high. You can get a better understanding of the accuracy by testing the outcomes for different probability thresholds.

Now, inspect the most influential features in the model.

  1. Run the following query to check feature importance:
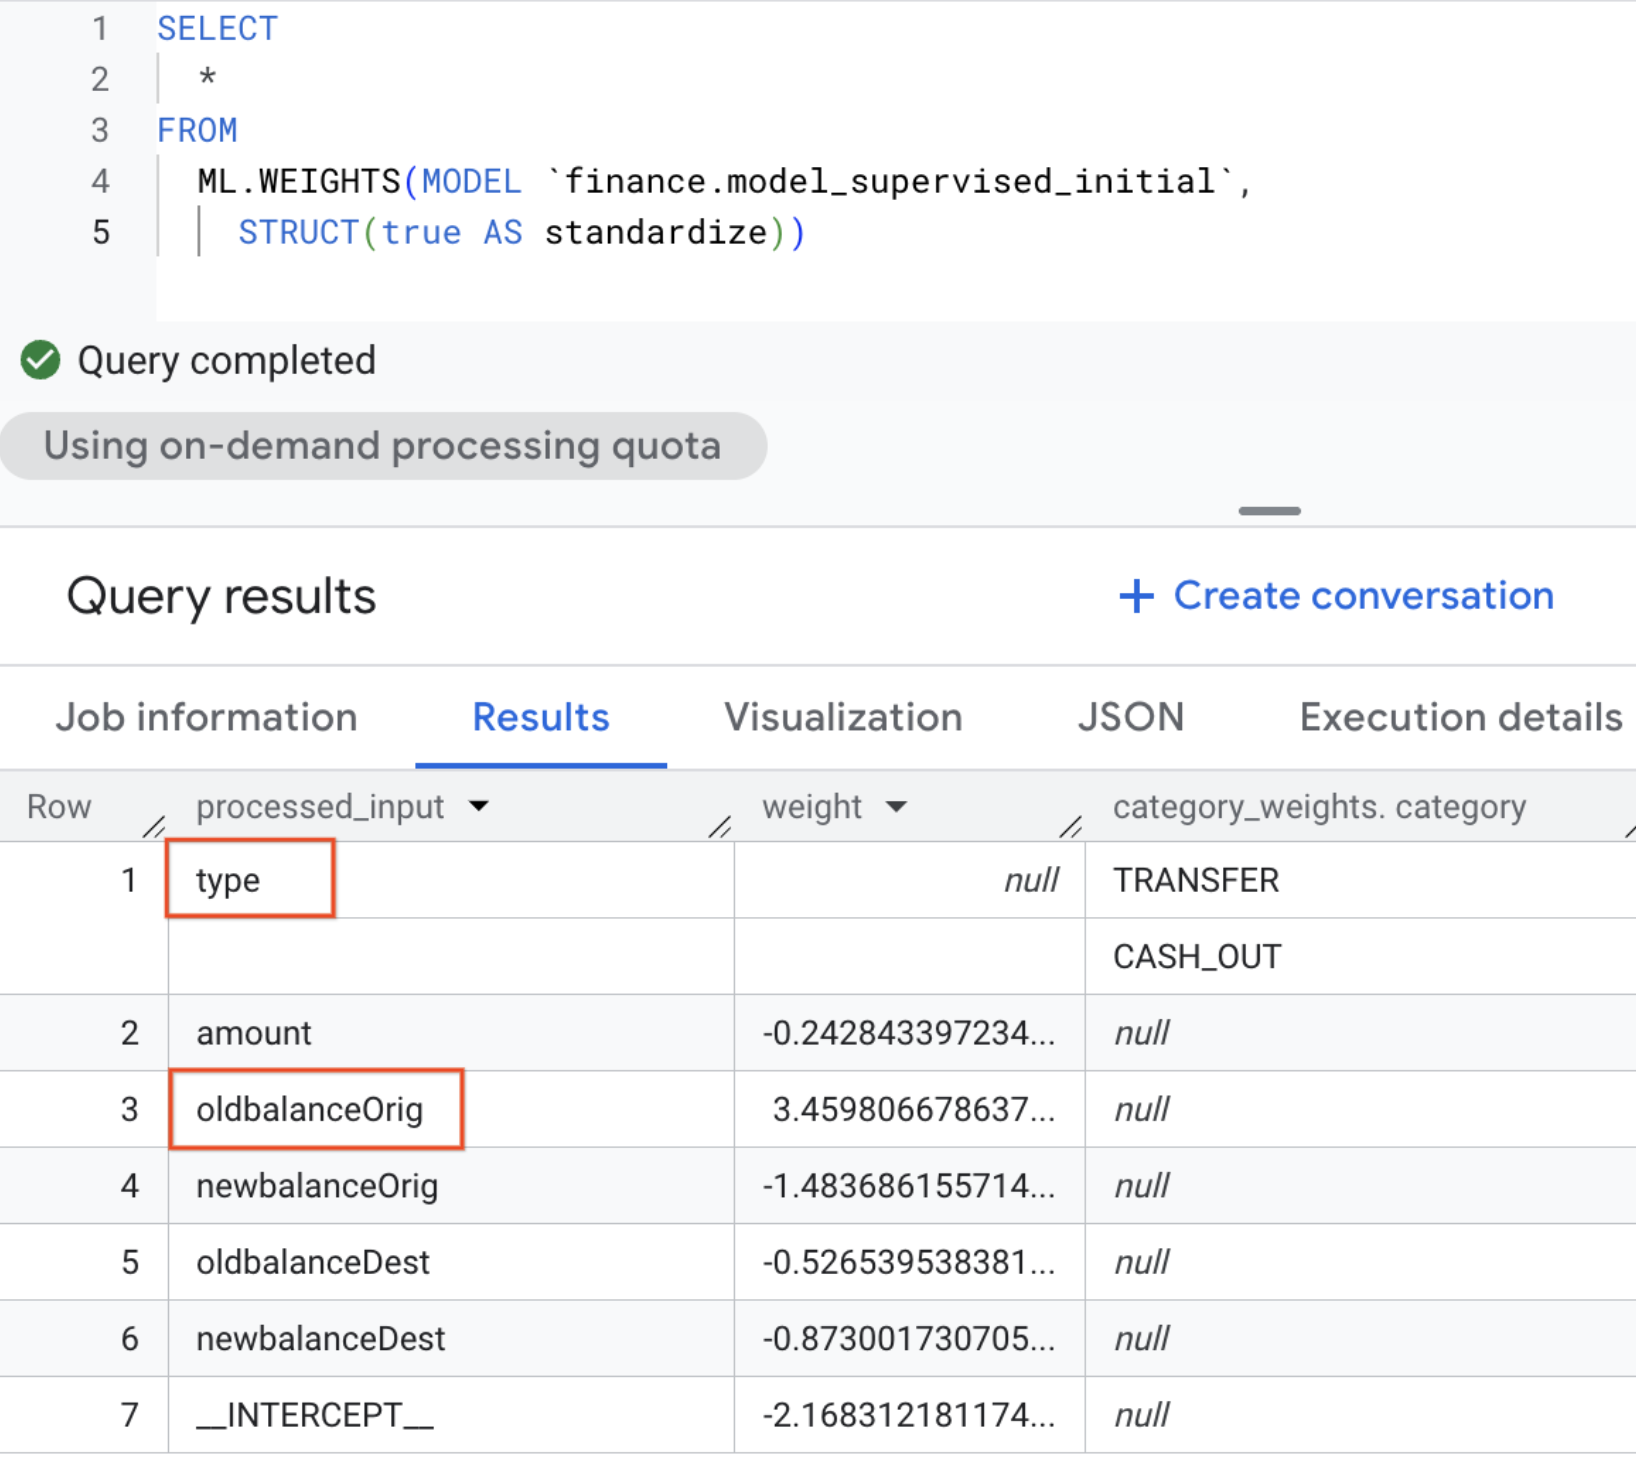
SELECT * FROM ML.WEIGHTS(MODEL `finance.model_supervised_initial`, STRUCT(true AS standardize))

The weights are standardized to eliminate the impact of the scale of the variables using the standardize option. Larger weights indicate more important features. The sign of the weight indicates the direction, depending on the direct or inverse relationship with the target.

Pause and reflect:

  • Which two variables look the most important? oldbalanceOrig and type are the most important variables.

Standardized weights for the type and oldbalanceOrig variables

Click Check my progress to verify the objective. Train a Supervised Machine Learning Model

Task 8. Improve your model

Now create a second supervised model to compare accuracy.

  • Create a gradient boosted tree model by running the following query:
CREATE OR REPLACE MODEL finance.model_supervised_boosted_tree OPTIONS(model_type='BOOSTED_TREE_CLASSIFIER', INPUT_LABEL_COLS = ["isfraud"] ) AS SELECT type, amount, oldbalanceOrig, newbalanceOrig, oldbalanceDest, newbalanceDest, isFraud FROM finance.fraud_data_model Note: It takes a few minutes for the model to finish training.

Next, you compare the two models you created and choose the best one.

Task 9. Evaluate your supervised machine learning models

After creating the models, you can evaluate the performance of each classifier using the ML.EVALUATE function. The ML.EVALUATE function evaluates the predicted values against actual data.

  • Run the following queries to combine the evaluation results from the two models into a single table and choose the champion model to use for scoring new data:
CREATE OR REPLACE TABLE finance.table_perf AS SELECT "Initial_reg" as model_name, * FROM ML.EVALUATE(MODEL `finance.model_supervised_initial`, ( SELECT * FROM `finance.fraud_data_model` )) insert finance.table_perf SELECT "improved_reg" as model_name, * FROM ML.EVALUATE(MODEL `finance.model_supervised_boosted_tree`, ( SELECT * FROM `finance.fraud_data_model` ))

Pause and reflect:

  • Which model provides the best performance? First, you trained a logistic regression model (model_supervised_initial), and then you trained a boosted tree model (model_supervised_boosted_tree) as the second supervised model. The boosted tree model performs better when you compare the performance metrics in finance.table_perf.

Task 10. Predict fraudulent transactions on test data

The last step in machine learning is to use a trained model to predict outcomes on new datasets.

The machine learning algorithms in BigQuery ML create a nested variable named predicted_<target_name>_probs. This variable includes the probability scores for the model decision (either fraudulent or genuine).

  • Run the following query in BigQuery to predict fraudulent transactions on the test data that you created earlier in the lab (the WHERE clause filters for transactions with a fraud probability score greater than 0.5):
SELECT id, label as predicted, isFraud as actual FROM ML.PREDICT(MODEL `finance.model_supervised_initial`, ( SELECT * FROM `finance.fraud_data_test` ) ), unnest(predicted_isfraud_probs) as p where p.label = 1 and p.prob > 0.5

Pause and reflect:

  • What is the proportion of fraudulent activities in the predicted set of transactions? Less than 3%.
  • How much has the event rate increased in the predicted set of rows compared to the overall test data? More than 95%.

Click Check my progress to verify the objective. Predict Fraudulent Transactions on Test Data

Congratulations!

Next steps

Google Cloud training and certification

...helps you make the most of Google Cloud technologies. Our classes include technical skills and best practices to help you get up to speed quickly and continue your learning journey. We offer fundamental to advanced level training, with on-demand, live, and virtual options to suit your busy schedule. Certifications help you validate and prove your skill and expertise in Google Cloud technologies.

Manual Last Updated on November 06, 2026

Lab Last Tested November 05, 2026

Copyright 2026 Google LLC. All rights reserved. Google and the Google logo are trademarks of Google LLC. All other company and product names may be trademarks of the respective companies with which they are associated.

准备工作

  1. 实验会创建一个 Google Cloud 项目和一些资源,供您使用限定的一段时间
  2. 实验有时间限制,并且没有暂停功能。如果您中途结束实验,则必须重新开始。
  3. 在屏幕左上角,点击开始实验即可开始

使用无痕浏览模式

  1. 复制系统为实验提供的用户名和密码
  2. 在无痕浏览模式下,点击打开控制台

登录控制台

  1. 使用您的实验凭证登录。使用其他凭证可能会导致错误或产生费用。
  2. 接受条款,并跳过恢复资源页面
  3. 除非您已完成此实验或想要重新开始,否则请勿点击结束实验,因为点击后系统会清除您的工作并移除该项目

此内容目前不可用

一旦可用,我们会通过邮件告知您

太好了!

一旦可用,我们会通过邮件联系您

一次一个实验

确认结束所有现有实验并开始此实验

使用无痕浏览模式运行实验

使用无痕模式或无痕浏览器窗口是运行此实验的最佳方式。这可以避免您的个人账号与学生账号之间发生冲突,这种冲突可能导致您的个人账号产生额外费用。