

准备工作
- 实验会创建一个 Google Cloud 项目和一些资源,供您使用限定的一段时间
- 实验有时间限制,并且没有暂停功能。如果您中途结束实验,则必须重新开始。
- 在屏幕左上角,点击开始实验即可开始
Examine a custom rule in Suricata
/ 1
Trigger a custom rule in Suricata
/ 1
Examine eve.json output
/ 1
Examine a custom rule in Suricata
/ 1
Trigger a custom rule in Suricata
/ 1
Examine eve.json output
/ 1
Previously, you learned about packet analysis and the basic syntax and components of intrusion detection systems (IDS) signatures and rules. You also learned how to examine a prewritten signature and its log output in Suricata, an open-source intrusion detection system, intrusion prevention system, and network analysis tool.
In this lab activity, you’ll explore more about Suricata alerts and logs, including the general process of rule creation.
The Suricata tool monitors network interfaces and applies rules to the packets that pass through the interface. Suricata determines whether each packet should generate an alert and be dropped, rejected, or allowed to pass through the interface.
Source and destination networks must be specified in the Suricata configuration. Custom rules can be written to specify which traffic should be processed.
You’ll examine a rule and practice using Suricata to trigger alerts on network traffic. You’ll also analyze log outputs, such as a fast.log and eve.json file. This will help you understand some of the alerts and logs generated by Suricata.
Let’s get started with Suricata!
In this scenario, you’re a security analyst who must monitor traffic on your employer's network. You’ll be required to configure Suricata and use it to trigger alerts.
Here’s how you'll do this task: First, you'll explore custom rules in Suricata. Second, you'll run Suricata with a custom rule in order to trigger it, and examine the output logs in the fast.log file. Finally, you’ll examine the additional output that Suricata generates in the standard eve.json log file.
For the purposes of the tests you’ll run in this lab activity, you’ve been supplied with a sample.pcap file and a custom.rules file. These reside in your home folder.
Let’s define the files you’ll be working with in this lab activity:
The sample.pcap file is a packet capture file that contains an example of network traffic data, which you’ll use to test the Suricata rules. This will allow you to simulate and repeat the exercise of monitoring network traffic.
The custom.rules file contains a custom rule when the lab activity starts. You’ll add rules to this file and run them against the network traffic data in the sample.pcap file.
The fast.log file will contain the alerts that Suricata generates. The fast.log file is empty when the lab starts. Each time you test a rule, or set of rules, against the sample network traffic data, Suricata adds a new alert line to the fast.log file when all the conditions in any of the rules are met. The fast.log file can be located in the /var/log/suricata directory after Suricata runs.The fast.log file is considered to be a depreciated format and is not recommended for incident response or threat hunting tasks but can be used to perform quick checks or tasks related to quality assurance.
The eve.json file is the main, standard, and default log for events generated by Suricata. It contains detailed information about alerts triggered, as well as other network telemetry events, in JSON format. The eve.json file is generated when Suricate runs, and can also be located in the /var/log/suricata directory.
When you create a new rule, you'll need to test the rule to confirm whether or not it worked as expected. You can use the fast.log file to quickly compare the number of alerts generated each time you run Suricata to test a signature against the sample.pcap file.
It’s time to get started.
analyst, already logged in to a Bash shell. This means you can start with the tasks as soon as you click the Start Lab button.
You'll need to start the lab before you can access the materials. To do this, click the green “Start Lab” button at the top of the screen.
After you click the Start Lab button, you will see a shell, where you will be performing further steps in the lab. You should have a shell like this:
When you have completed all the tasks, refer to the End your Lab section that follows the tasks for information on how to end your lab.
The /home/analyst directory contains a custom.rules file that defines the network traffic rules, which Suricata captures.
In this task, you’ll explore the composition of the Suricata rule defined in the custom.rules file.
cat command to display the rule in the custom.rules file:less command can also be used to read file content one page at a time, making it useful for reading lengthy output.
The command returns the rule as the output in the shell:
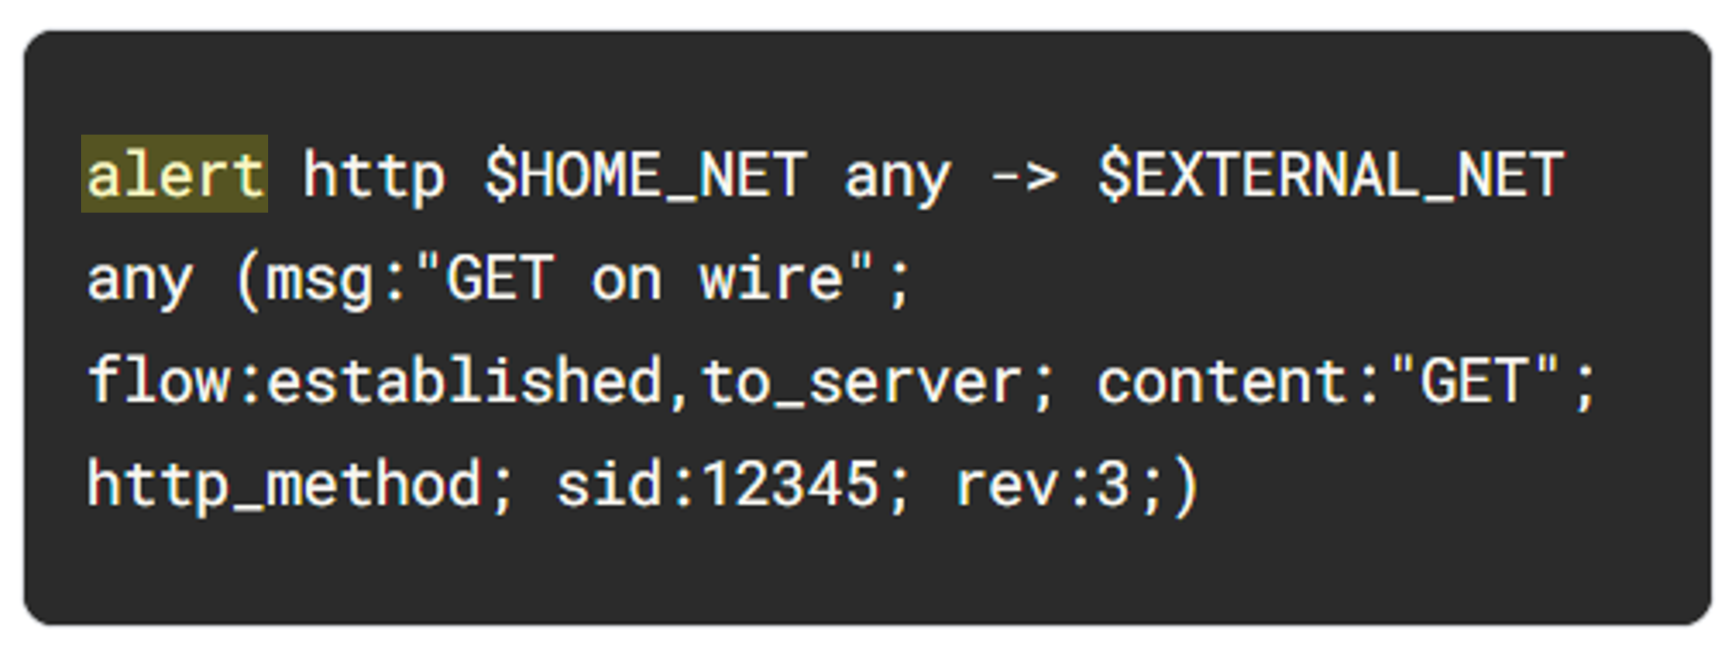
This rule consists of three components: an action, a header, and rule options.
Let's examine each component in more detail.
The action is the first part of the signature. It determines the action to take if all conditions are met.
Actions differ across network intrusion detection system (NIDS) rule languages, but some common actions are alert, drop, pass, and reject.
Using our example, the file contains a single alert as the action. The alert keyword instructs to alert on selected network traffic. The IDS will inspect the traffic packets and send out an alert in case it matches.
Note that the drop action also generates an alert, but it drops the traffic. A drop action only occurs when Suricata runs in IPS mode.
The pass action allows the traffic to pass through the network interface. The pass rule can be used to override other rules. An exception to a drop rule can be made with a pass rule. For example, the following rule has an identical signature to the previous example, except that it singles out a specific IP address to allow only traffic from that address to pass:
The reject action does not allow the traffic to pass. Instead, a TCP reset packet will be sent, and Suricata will drop the matching packet. A TCP reset packet tells computers to stop sending messages to each other.
You’ll most often use the alert rule in this lab activity.
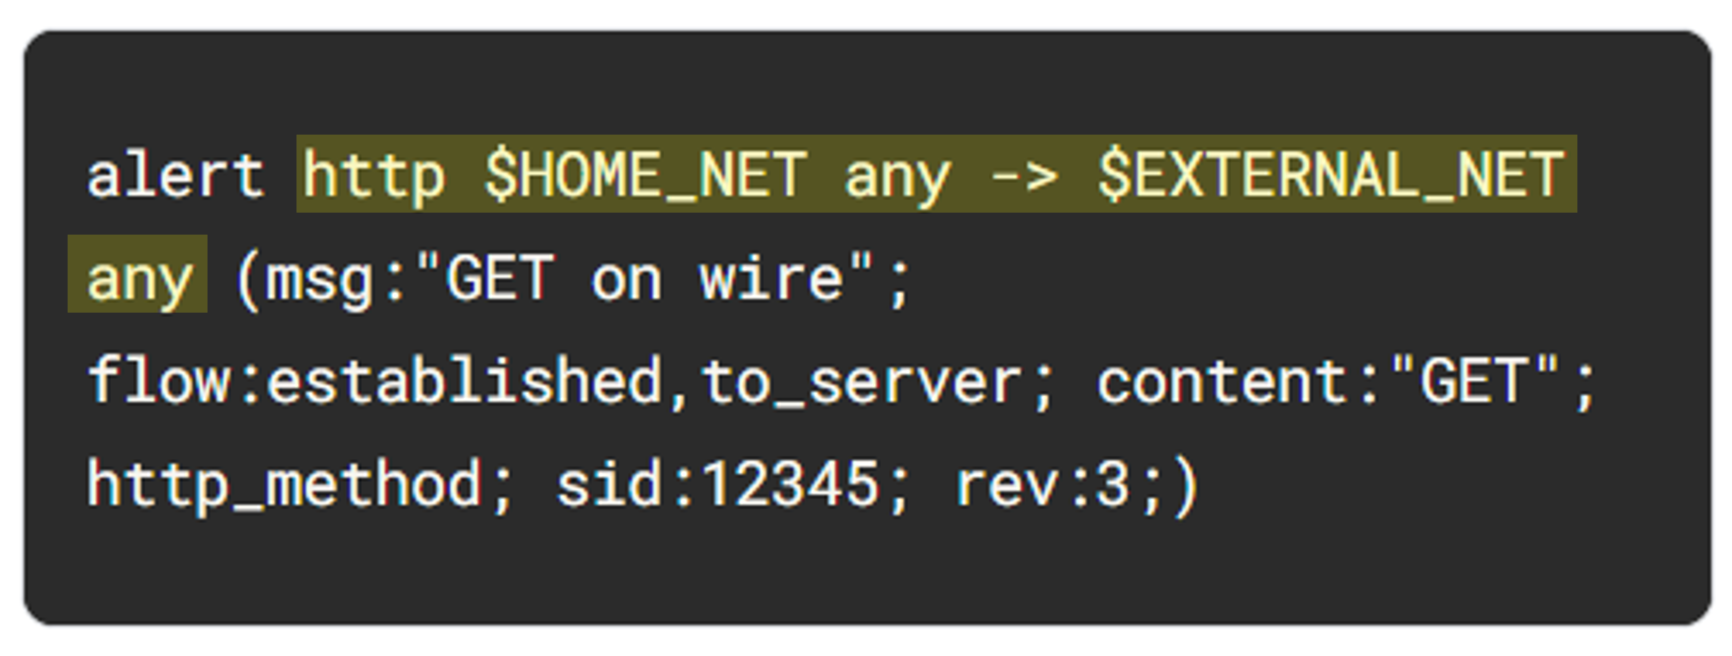
The next part of the signature is the header. The header defines the signature’s network traffic, which includes attributes such as protocols, source and destination IP addresses, source and destination ports, and traffic direction.
The next field after the action keyword is the protocol field. In our example, the protocol is http, which determines that the rule applies only to HTTP traffic.
The parameters to the protocol http field are $HOME_NET any -> $EXTERNAL_NET any. The arrow indicates the direction of the traffic coming from the $HOME_NET and going to the destination IP address $EXTERNAL_NET.
$HOME_NET is a Suricata variable defined in /etc/suricata/suricata.yaml that you can use in your rule definitions as a placeholder for your local or home network to identify traffic that connects to or from systems within your organization.
In this lab $HOME_NET is defined as the 172.21.224.0/20 subnet.
The word any means that Suricata catches traffic from any port defined in the $HOME_NET network.
$ symbol indicates the start of a variable. Variables are used as placeholders to store values.
So far, we know that this signature triggers an alert when it detects any http traffic leaving the home network and going to the external network.
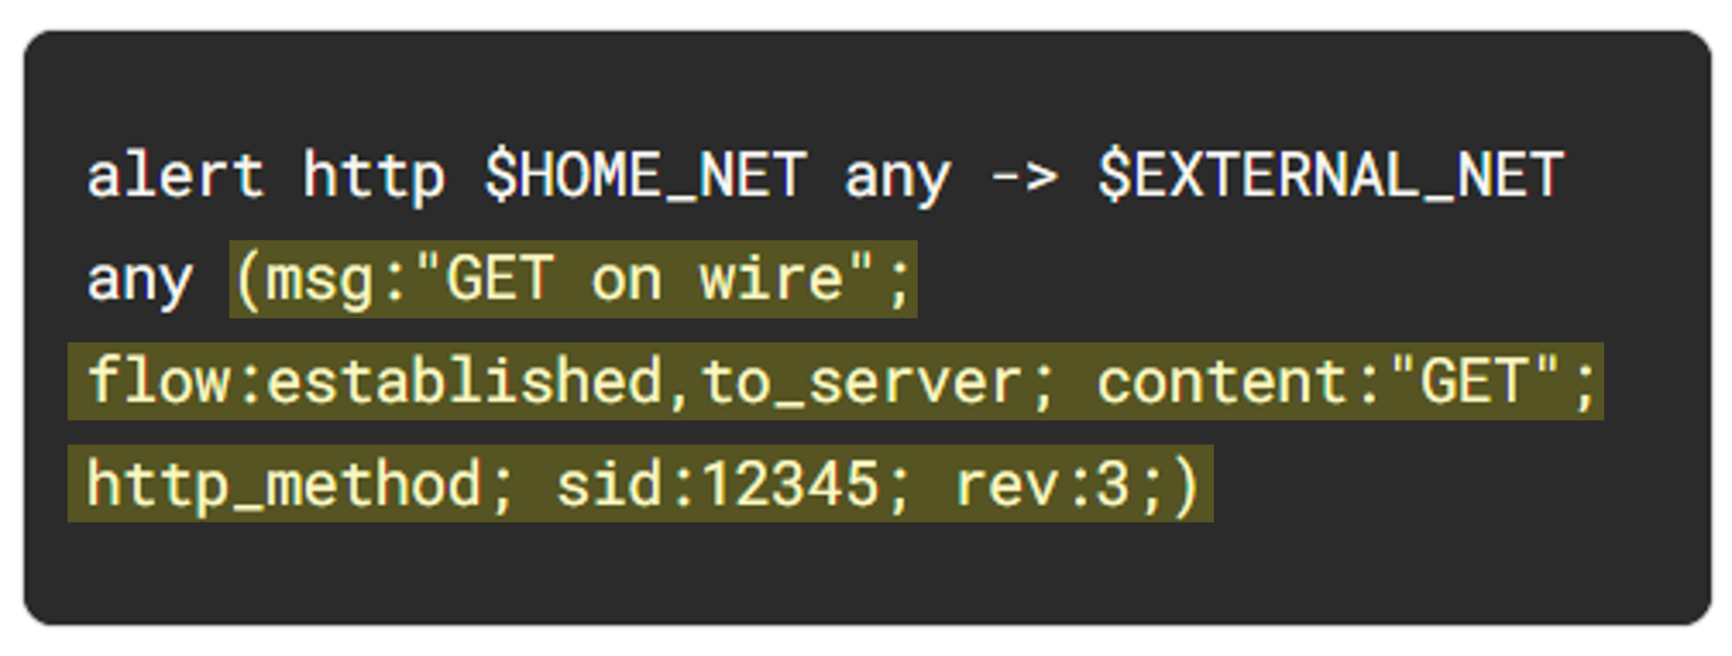
The many available rule options allow you to customize signatures with additional parameters. Configuring rule options helps narrow down network traffic so you can find exactly what you’re looking for. As in our example, rule options are typically enclosed in a pair of parentheses and separated by semicolons.
Let's further examine the rule options in our example:
msg: option provides the alert text. In this case, the alert will print out the text “GET on wire”, which specifies why the alert was triggered.flow:established,to_server option determines that packets from the client to the server should be matched. (In this instance, a server is defined as the device responding to the initial SYN packet with a SYN-ACK packet.)content:"GET" option tells Suricata to look for the word GET in the content of the http.method portion of the packet.sid:12345 (signature ID) option is a unique numerical value that identifies the rule.rev:3 option indicates the signature's revision which is used to identify the signature's version. Here, the revision version is 3.To summarize, this signature triggers an alert whenever Suricata observes the text GET as the HTTP method in an HTTP packet from the home network going to the external network.
Click Check my progress to verify that you have completed this task correctly.
Now that you are familiar with the composition of the custom Suricata rule, you must trigger this rule and examine the alert logs that Suricata generates.
/var/log/suricata folder:Note that before running Suricata, there are no files in the /var/log/suricata directory.
suricata using the custom.rules and sample.pcap files:This command starts the Suricata application and processes the sample.pcap file using the rules in the custom.rules file. It returns an output stating how many packets were processed by Suricata.
sudo is required to process packet capture files with Suricata, although it may not be required in a real-world environment.
Now you’ll further examine the options in the command:
-r sample.pcap option specifies an input file to mimic network traffic. In this case, the sample.pcap file.-S custom.rules option instructs Suricata to use the rules defined in the custom.rules file.-k none option instructs Suricata to disable all checksum checks.As a refresher, checksums are a way to detect if a packet has been modified in transit. Because you are using network traffic from a sample packet capture file, you won't need Suricata to check the integrity of the checksum.
Suricata adds a new alert line to the /var/log/suricata/fast.log file when all the conditions in any of the rules are met.
/var/log/suricata folder again:Note that after running Suricata, there are now four files in the /var/log/suricata directory, including the fast.log and eve.json files. You'll examine these files in more detail.
cat command to display the fast.log file generated by Suricata:The output returns alert entries in the log:
Each line or entry in the fast.log file corresponds to an alert generated by Suricata when it processes a packet that meets the conditions of an alert generating rule. Each alert line includes the message that identifies the rule that triggered the alert, as well as the source, destination, and direction of the traffic.
Click Check my progress to verify that you have completed this task correctly.
In this task, you must examine the additional output that Suricata generates in the eve.json file.
As previously mentioned, this file is located in the /var/log/suricata/ directory.
The eve.json file is the standard and main Suricata log file and contains a lot more data than the fast.log file. This data is stored in a JSON format, which makes it much more useful for analysis and processing by other applications.
cat command to display the entries in the eve.json file:The output returns the raw content of the file. You'll notice that there is a lot of data returned that is not easy to understand in this format.
jq command to display the entries in an improved format:less command and to return to the command-line prompt.Note how much easier it is to read the output now as opposed to the cat command output.
jq tool is very useful for processing JSON data, however, a full explanation of its capabilities is outside of the scope of this lab.
Answer: The value of the severity property for the first alert is 3.
jq command to extract specific event data from the eve.json file:jq command above extracts the fields specified in the list in the square brackets from the JSON payload. The fields selected are the timestamp (.timestamp), the flow id (.flow_id), the alert signature or msg (.alert.signature), the protocol (.proto), and the destination IP address (.dest_ip).
Answer: The destination IP address is 142.250.1.102.
Answer: The first event in the eve.json file has "GET on WIRE" as the alert signature.
The following is an example of the output of the command above. The flow_id is the long numeric field highlighted in orange in each row returned.
jq command to display all event logs related to a specific flow_id from the eve.json file. The flow_id value is a 16-digit number and will vary for each of the log entries. Replace X with any of the flow_id values returned by the previous query:flow_id to each network flow. All logs from a network flow share the same flow_id. This makes the flow_id field a useful field for correlating network traffic that belongs to the same network flows.
Click Check my progress to verify that you have completed this task correctly.
Great work!
You’ve completed this activity and should be able to use Suricata to trigger alerts on network traffic.
You now have practical experience in running Suricata to
fast.log and eve.json output.You’ve developed a key skill in your journey towards becoming a security analyst.
Before you end the lab, make sure you’re satisfied that you’ve completed all the tasks, and follow these steps:


此内容目前不可用
一旦可用,我们会通过电子邮件告知您

太好了!
一旦可用,我们会通过电子邮件告知您

一次一个实验
确认结束所有现有实验并开始此实验
完成此快速步骤即可开始实验。