GSP1332

Overview
What if you could leverage your existing SQL knowledge to develop ways for your business users to query and visualize data without needing to write their own SQL? Looker makes that possible through LooKML, short for Looker Modeling Language!
With LookML, you can define attributes, aggregations, calculations, and data relationships in your database, and then make these objects available through Explores, which are views that can be queried by your business users without writing SQL. In Looker, business users work in the Explores to run the queries and build the visualizations that they need without worrying about the complexities of the SQL or defining the relationships between data tables.
LookML also fosters DRY ("Don't Repeat Yourself") code and is independent of particular SQL dialects, meaning that you define LookML objects once, and the Looker uses that code to generate the SQL queries needed to return the requested data. Specifically, LookML is defined in projects, which are collections of LookML files including at least the model file to define data relationships and some view files to define the tables that are being surfaced and joined in the model file.
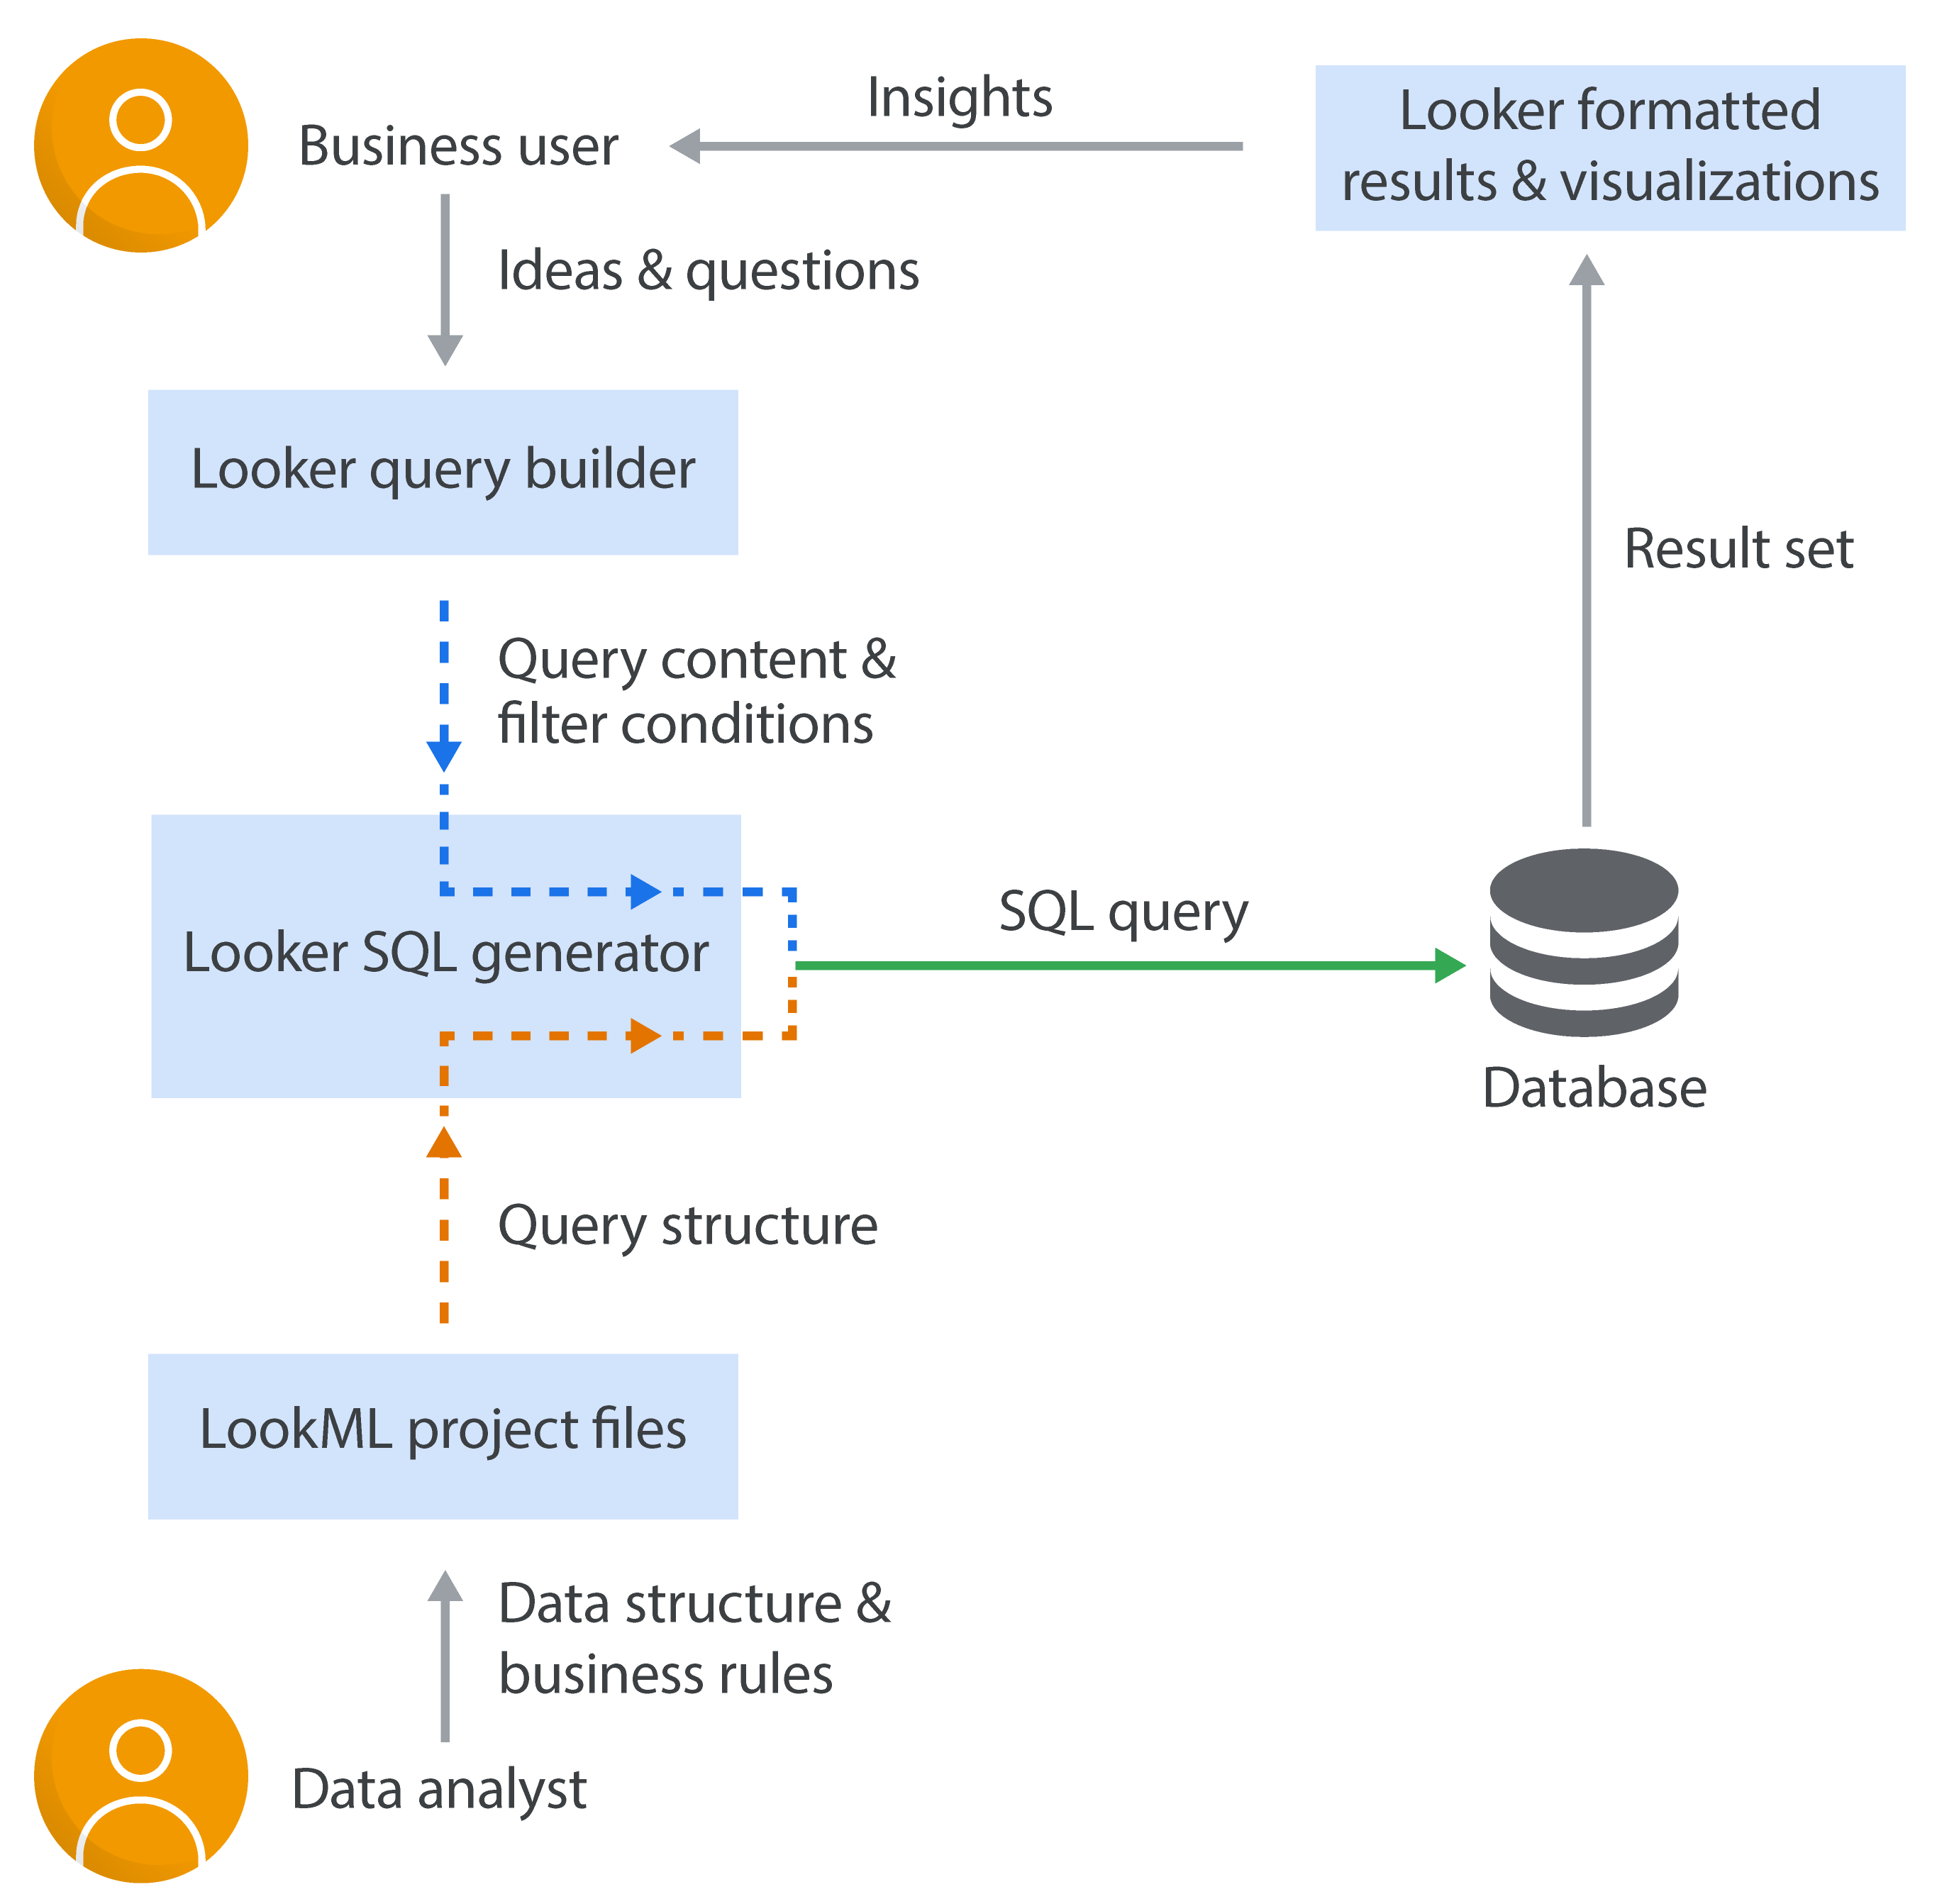
The diagram below demonstrates how LookML supports Looker to manage query structure independently from query content. You as the data analyst (or LookML developer) define the query structure (e.g. how tables are joined), and then independently, the business user provides the query content when they build a query in an Explore (e.g. data columns to include, aggregation functions to compute, and filtering expressions to apply in the query). The query structure and query content are automatically integrated by Looker to send a query to your database to retrieve the desired results.
In this lab, you start with a simple project that includes only a basic model file and a single view file as a starting point. This view file defines attributes (referred to as dimensions) and aggregations (referred to a measures) for a database table containing information about users of an ecommerce site. Throughout the lab, you learn how to write LookML to create new view files to include more tables (such as information about their orders), define Explores in the model file to join tables and make the data available to business users, and apply DRY principles as you create new objects in the LookML project. Your ultimate goal is to create an Explore that business users can use to query information about the top 100 customers of a fictitious eCommerce clothing site for additional marketing efforts.
What you'll learn
In this lab, you learn how to:
- Use SQL Runner in Looker to review database tables.
- Create a new view file with dimensions and measures defined using LookML.
- Define a new Explore by joining two tables in a LookML model file.
- Define new dimensions and measures using existing dimensions and measures.
- Create a native derived table based on existing Looker dimensions and measures to leverage DRY principles in LookML.
Prerequisites
This lab is targeted toward SQL professionals who want to leverage their existing SQL knowledge to write LookML in Looker. To maximize your learning, it is recommended that you have the following:
- Experience with writing SQL queries to select, aggregate, and join data across tables
- Basic familiarity with Looker as a business intelligence (BI) and analytics solution
For more background on LookML, explore the course titled Developing Data Models with LookML, particularly Module 1 titled Introduction to Looker and LookML.
Setup and requirements
Before you click the Start Lab button
Read these instructions. Labs are timed and you cannot pause them. The timer, which starts when you click Start Lab, shows how long Google Cloud resources are made available to you.
This hands-on lab lets you do the lab activities yourself in a real cloud environment, not in a simulation or demo environment. It does so by giving you new, temporary credentials that you use to sign in and access Google Cloud for the duration of the lab.
To complete this lab, you need:
- Access to a standard internet browser (Chrome browser recommended).
Note: Use an Incognito or private browser window to run this lab. This prevents conflicts between your personal account and the Student account, which may cause extra charges incurred to your personal account.
- Time to complete the lab—remember, once you start, you cannot pause a lab.
Note: If you already have a personal Google Cloud account or project, do not use it for this lab to avoid extra charges to your account.
How to start your lab and sign in to Looker
-
When ready, click Start Lab.
The Lab Details pane appears with the temporary credentials that you must use for this lab.
If you need to pay for the lab, a pop-up opens for you to select your payment method.
Notice your lab credentials in the Lab details pane. You use them to sign in to the Looker instance for this lab.
Note: If you use other credentials, you will get errors or incur charges.
-
Click Open Looker.
-
Enter the provided Username and Password in the Email and Password fields.
Username:
{{{looker.developer_username | Username}}}
Password:
{{{looker.developer_password | Password}}}
Important: You must use the credentials from the Lab Details pane on this page. Do not use your Google Cloud Skills Boost credentials. If you have a personal Looker account, do not use it for this lab.
-
Click Log In.
After a successful login, you see the Looker instance for this lab.
Task 1. Explore database tables in SQL Runner
Looker provides a tool named SQL Runner for you to directly access your database tables, which is very useful to review your data tables before writing LookML to create view files and define Explores in your model file.
In this lab environment, a BigQuery dataset named thelook__ecommerce is available through a database connection named bigquery_public_data_looker. In this task, you use SQL Runner to explore the tables in this dataset, which contains information on users (customers), orders, and products, so that you can start identifying which tables you need to define in new view files and which table joins you need to define in the model file.
Explore the available tables in SQL Runner
- On the Looker navigation menu (icon with three horizontal lines), click Develop > SQL Runner.
Notice that there is a default database connection for BigQuery (bigquery_public_data_looker) and Google Cloud project ID, which is the current project ID for this lab: . In the next steps, you update the project to a different project that contains the data used in this lab.
- In the left panel of SQL Runner, click on Settings (gear icon to the right of Connection), and select Search public projects.
There is no longer a default value for the project ID, so you are now able to provide the project ID for a different Google Cloud project that contains the data you need for this lab.
-
For Project, type cloud-training-demos, and press Enter.
-
For Dataset, select thelook_ecommerce.
Notice that there are seven tables in this dataset:
- distribution_centers
- events
- inventory_items
- order_items
- orders
- products
- users
In BigQuery, you would likely start to explore this dataset with some simple queries to understand what the data contain. In Looker, you can run queries in SQL Runner to do the same exploration.
Imagine you want to know where the sale price of an order is stored. Since there are two tables that may have this information (orders and order_items), a first step can be to query the columns in each table to learn more about what the tables contain.
- Under Tables, click on orders, and explore the list of columns.
There are many columns about an order including the number of items (num_of_item), but there does not appear to be any columns about the sale price of the order.
- Under Tables again, click on order_items, and explore the list of columns.
In this table, there is a column named sale_price. There are also columns that contain ids (or identifiers) related to products, inventory, and users. Looks useful!
- To the right of the order_items table name, click on Settings (gear icon to the right), and select Select 10.
The SQL Query pane auto-populates with a simple select query.
- Click Run to run the query, and review the results in the Results pane.
In the query results, you are able to see that sale_price contains numeric values, and there are indeed many ids in this table, which may allow joins to other tables in the dataset such as users, products, and inventory_items.
Build queries in the Explore generated by Looker
From SQL Runner, you can also go directly to an ad hoc Explore that is auto-generated by Looker. In this section, you go to the generated Explore for the order_items table, so that you can start to understand how business users interact with data in Explore and how Looker generates the SQL needed to retrieve query results.
- To the right of the order_items table name, click on Settings (gear icon to the right), and select Explore Table.
You are now in a simple Looker Explore that resembles the ones that you (as LookML developer) can define in model files. While Explores defined by LookML developers can have multiple views, this Explore only has one view, which is for the order_items table. In this Explore, you can experience how business users interact with Explores to select dimensions (unaggregated, categorical data such as user_id) and measures (aggregations such as count) to build queries without writing SQL code.
- Under Dimensions, click User ID to select it, and under Measures, click Count to select it. Click Run.
The Results pane displays the count of ordered items by user ID. If not already expanded, you can click on the down arrow next to Visualization to see a simple visualization of the results.
By selecting the dimensions and measures, you are adding them to the query that is generated by Looker and then sent to BigQuery when you click the Run button.
- In the Results pane, click on SQL to see the SQL statement that was generated by Looker and sent to BigQuery to retrieve the results.
Notice that the canonical form of this query looks very familiar to SQL professionals!
SELECT
order_items.user_id AS order_items_user_id,
COUNT(*) AS order_items_count
FROM `cloud-training-demos.thelook_ecommerce.order_items`
AS order_items
GROUP BY
1
ORDER BY
2 DESC
LIMIT 500
As a dimension, user_id is listed as the first item in the SELECT without an aggregation and in the GROUP_BY to provide the category for aggregating the ordered items.
The query results are ordered (descending order) by the second item in the SELECT, which is order_items_count as the name for the COUNT aggregation representing the number of ordered items, or in Looker terms, a measure within the Explore.
Run queries in SQL Runner
- Return to SQL Runner, and repeat the previous section to explore the table named users, which contains contact and location data for the customers of the site such as name, email address, and country.
Now that you have an idea of what the users table contains, you can write more complex queries to summarize the top orders and then get related user data.
Start with a simple query of the top 100 order totals and the associated user ID.
- In the SQL Query window, add the following query, and click Run:
SELECT
order_items.user_id AS user_id,
SUM(order_items.sale_price) AS total_revenue
FROM cloud-training-demos.thelook_ecommerce.order_items
GROUP BY user_id
ORDER BY total_revenue DESC
LIMIT 100
The top 5 results appear as follows:
| user_id |
total_revenue |
| 11398 |
2166.4799976348877 |
| 90469 |
1840.4200019836426 |
| 49844 |
1749.9600048065186 |
| 15761 |
1552 |
| 14188 |
1532.9899997711182 |
Test your knowledge of how data is represented and selected in a Looker Explore
Run queries using joins in SQL Runner
Now imagine your business users want to know the user email associated with each of the top 100 order totals, so that they can send additional marketing promotions to them. As a SQL professional, you are familiar with modifying queries to join tables such as order_items and users, so that you can pull specific attributes like user email for each of the top 100 order totals.
In the case of order information, it is possible that there are many ordered items by a single user id, or no ordered items at all, meaning a user has not placed any orders. So considering the join type is important when writing your own SQL, particularly when selecting between LEFT JOIN (which retains unmatched records even if there is no match from the incoming left table) and INNER JOIN (which drops unmatched records).
Note that in Looker, left outer joins are the default to allow for flexible querying in the Explore. Rather than using an INNER JOIN to drop unmatched records, Looker recommends defining additional dimensions (such as a yes/no dimension for orders that do not have a user id), so that business users can easily query for both situations in the same Explore. In this scenario, business users can get all data to start, and then use the flags to filter results based on whether there are null values in a particular column of interest (in this case to identify orders without a user id).
For the join between the order_items and users tables, start by exploring the results produced by LEFT JOIN, and review the top 100 results.
- In the SQL Query window, add the following query, and click Run:
SELECT
order_items.user_id AS user_id,
users.email,
SUM(order_items.sale_price) AS order_revenue
FROM cloud-training-demos.thelook_ecommerce.order_items
LEFT JOIN cloud-training-demos.thelook_ecommerce.users
ON order_items.user_id = users.id
GROUP BY user_id, users.email
ORDER BY order_revenue DESC
LIMIT 100
Scroll through the top 100 order totals. For reference, the top 5 results appear as follows:
| user_id |
email |
total_revenue |
| 11398 |
andrewstein@example.net |
2166.4799976348877 |
| 90469 |
christopherlucas@example.org |
1840.4200019836426 |
| 49844 |
richardmeyers@example.net |
1749.9600048065186 |
| 15761 |
jakeesparza@example.com |
1552 |
| 14188 |
trevorhamilton@example.com |
1532.9899997711182 |
- Now modify the query to use INNER JOIN, and run it again:
SELECT
order_items.user_id AS user_id,
users.email,
SUM(order_items.sale_price) AS order_revenue
FROM cloud-training-demos.thelook_ecommerce.order_items
INNER JOIN cloud-training-demos.thelook_ecommerce.users
ON order_items.user_id = users.id
GROUP BY user_id, users.email
ORDER BY order_revenue DESC
LIMIT 100
Scroll through the top 100 order totals. For reference, the top 5 results appear as follows again:
| user_id |
email |
total_revenue |
| 11398 |
andrewstein@example.net |
2166.4799976348877 |
| 90469 |
christopherlucas@example.org |
1840.4200019836426 |
| 49844 |
richardmeyers@example.net |
1749.9600048065186 |
| 15761 |
jakeesparza@example.com |
1552 |
| 14188 |
trevorhamilton@example.com |
1532.9899997711182 |
In this example, the LEFT JOIN AND INNER JOIN produce the same results for the Top 100 order totals, which all have a user id.
As you continue to learn more about joining tables in LookML model files, it is a useful exercise to continue exploring your tables in SQL Runner, so that you can leverage your existing SQL knowledge to help you best define table relationships in the model file. Remember a key benefit of LookML is that you only need to define the join relationship once in the model file, and then your business users can query the joined tables without needing to know the specifics of how joins work in SQL.
In the next tasks, you finalize the view files needed to represent both the users and order_items tables with LookML in Task 2. Then in Task 3, you define a new Explore in the model file to join these tables, so that business users can query the Explore to answer the same questions you just did about the top 100 order totals but without writing any SQL code.
Click Check my progress to verify the objective.
Explore database tables in SQL Runner
Task 2. Create a new view file with defined dimensions and measures
In LookML, each data table is represented in a view file that allows you to define the dimensions and measures that are available to business users. The beauty of LookML is that you only have to define objects once, and then you can reference them throughout the LookML project as needed. This is a DRY code in action!
In this task, you start by exploring the existing view file for the users table, and then apply that knowledge to create a new view file for the order_items table.
Explore the view file for users
- On the Looker navigation menu (icon with three horizontal lines), click Develop, and then click on the LookML project named qwiklabs-looker.
You are now in the Looker Interactive Development Environment (IDE), in which you can review and edit the LookML files contained in the qwiklabs-looker project.
- In the File Browser, expand the arrow next to the views folder, and click on the users view to review the LookML.
There are three main sections in this view file:
- Definition of the view including the name and the source table (lines 7-8).
- Definitions of the dimensions including the
primary_key (the column named id) for the table (lines 14-89).
- Definitions of the measures. There is only one for this table, which represents a simple count aggregation (lines 96-100).
In the view file, you can start to notice some examples of how LookML allows you to write DRY code.
sql_table_name
At the beginning of the view definition, you see the sql_table_name parameter on line 8, which allows you to define the source database table name only once. This means that if you need to update the table name in the future, you only have to update it in one location in the file.
{TABLE}.field_name
Next, notice the syntax for the sql parameter of each dimension. The parameter value is defined using $ followed by {TABLE}.field_name to identify the column name for a dimension or measure (read more in the documentation). For example, $ followed by {TABLE}.first_name (line 22) defines a dimension for the column named first_name. After you define the dimension and measure once, you can use the dimension or measure name throughout your LookML project files. This means that future updates to the column names are only needed once in the original definition of the dimension and measure.
dimension_group
At the end of the dimensions section, you see a dimension_group named created (line 85), which represents the date that the user was created in the table. Notice that you are not defining individual dimensions for each timeframe such as date or quarter. Instead, dimension groups allow you to leverage DRY code by creating multiple dimensions with different time granularities in a single declaration! In the Explore, these dimensions are grouped together for business users to easily switch between different timeframes in their queries.
Create a new view file for order_items
Now that you have an idea of how LookML allows you to write DRY code, you can create a new view file for the order_items table and apply these principles to represent the table and data columns using LookML.
- On the Looker navigation menu (icon with three horizontal lines), click Develop, and then click the toggle button to enter Development mode (bottom left).
Enabling this option allows you to now edit the LookML files in the project within the Looker IDE.

- In the File Browser, next to the views folder, click Folder Options (three vertical dots), and select Create view from table.
To easily see the Folder Options, hover your cursor over the folder name views in the File Browser.
-
In the box for Enter custom db, type cloud-training-demos, and press Enter.
-
In the dataset results, expand the arrow next to thelook_ecommerce, and enable the checkbox for order_items.
-
Scroll to the bottom of the page, and click Create Views.
Looker autogenerates the view file and provides the initial LookML code for the table.
Notice the sql_table_name parameter in line 2 to define the table name. Continue reviewing the file, and notice the various dimensions (such as sale_price and status) and dimension groups that are defined for various dates (such as created, delivered, returned, and shipped).
See how easy it is to get started with LookML for your database tables! This LookML is a solid starting point for providing dimensions to business users. For measures, there are a few changes that would be useful such as updating the display name of the existing count measure and adding an additional measure for total sale price.
Note: Be sure to keep the indentations that are included in each code block below to ensure the proper indentation in the new view file. Comments are included using # and can extend to new lines.
- In the existing
count measure, add a label parameter to line 99, so that the your measure definition appears as follow:
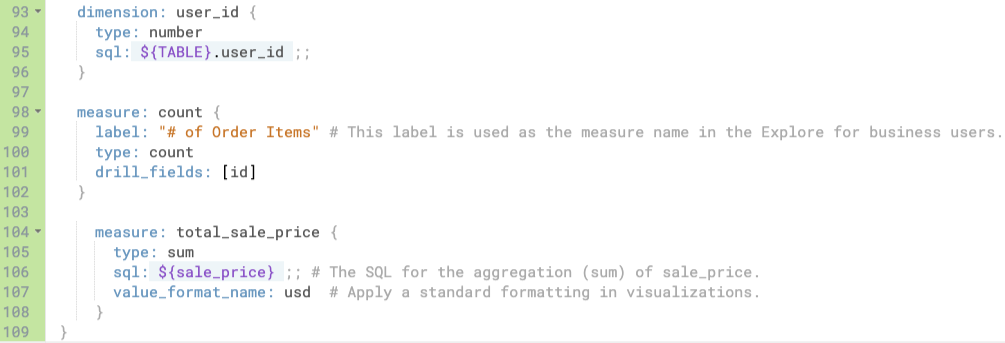
measure: count {
label: "# of Order Items" # Name of measure in the Explore.
type: count
drill_fields: [id]
}
-
Add two new blank lines between lines 102 and 103, so that you can retain the closing curly bracket } at the end of the file.
-
On the new line 104, add a new measure that aggregates the dimension named sale_price to provide total_sale_price as a sum:
measure: total_sale_price {
type: sum
sql: ${sale_price} ;; # SQL for aggregation (sum) of sale_price.
value_format_name: usd # Apply a standard formatting for visualizations.
}
Note: Be sure to include the last closing curly bracket } at the end of the file (line 109). This closes out the definition of the view.
- Click Save Changes.
The bottom portion of the view file should now resemble the following:
The new view called order_items is now ready for you to create more dimensions and measures, join it with other tables to define an Explore in the model file, or finish out the Git workflow to send your changes to production.
For now, you validate changes before you use Git to deploy the changes to this lab's production environment of Looker.
Validate the LookML
Notice that on the top right of the Looker IDE, there is a disabled Saved button, and there is a message that says "Recheck Errors". This means that the previous click of Save Changes was successful. During the save, Looker validated the code modified in the files, and no errors were found.
As you continue modifying code, it can be helpful to manually validate your code as you make changes.
-
On the top left of the Looker IDE, click Project Health (icon of a checklist on the same row as "Recheck Errors" and "Commit Changes & Push").
-
In the LookML validation section, click Validate LookML (icon of a checkmark enclosed in a circle).
The output message should return No LookML errors found.
Now that you have validated that the LookML code is valid, you can make your first commit to the local Git repository for this lab environment, and deploy the changes to this lab's production environment of Looker.
Commit changes and deploy to production
-
Click Validate LookML and then click Commit Changes & Push.
-
Add a commit message and click Commit.
-
Lastly, click Deploy to Production.
Note: If you receive a message of Git Error: Check Git Tab for info, click on Git Actions (fourth icon down in the File Browser), and click Deploy to Production again. Click on the File Browser icon again to return to the project files.
Click Check my progress to verify the objective.
Create a new view file with defined dimensions and measures
Want more practice with creating views?
Repeat the steps in the section titled Create a new view file for order_items to create new view files for other tables such as products and inventory_items.
Task 3. Populate a model file with a new Explore
Remember that your ultimate goal is to create an Explore that business users can use to query information about the top 100 customers of this eCommerce site for additional marketing efforts. Now that you have the views for users and order_items, you are ready to join these tables in the model file, so that business users can query these tables together in an Explore without writing any SQL.
In this task, you define an Explore named Ordered Items in the existing basic model file named qwiklabs-looker, and then you run some test queries in the Explore to see how the data will appear to business users as they run queries.
Structure of the join in the explore code
Before defining the Explore in the model file, it is useful to spend time to understand how joins are represented in LookML.
Below is the basic structure of an Explore definition in a model file. Notice that the join is defined using three main parameters: type, sql_on, and relationship.
explore: name_of_explore { # View name 1 for the base view of the Explore (for example, order_items).
label: "Display name for the Explore"
join: view_name_2 { # View name 2 that is being joined to view name 1 (for example, users).
type: join_type # If not specified, the default is left_outer. Three other options available: cross, full_outer, and inner.
sql_on: ${view_name_1.field_name} = ${view_name_2.field_name} ;; # Column to join the tables, often an ID field.
relationship: relationship_type # Defines the number of times that the join column value appears in each table, starting with view_name_1 followed by view_name_2.
}
}
The relationship parameter
Most of the previous syntax for defining Explores can easily be understood by SQL professionals particularly type and sql_on, in terms of defining joins between tables.
The added parameter for relationship allows you to further describe the join relationship by telling Looker how many times the value of the join column appears in each table, so that it can properly leverage the join when executing aggregations. There are four options for relationship: many_to_one, many_to_many, one_to_many, and one_to_one.
For example, selecting the correct value for relationship informs Looker that there can be multiple orders for a single user ID.
It is important to properly define the type of relationship in order for Looker to calculate accurate measures using symmetric aggregation. Symmetric aggregation prevents user queries from accidentally miscalculating aggregates such as sums, averages, and counts by making sure to count each fact in the calculation the correct number of times as well as by keeping track of what is being calculated.
In this example where there can be many orders to a single user, defining this relationship (along with accurate primary keys identified for each table) allows Looker to leverage symmetric aggregation to make sure that a user is not counted twice during aggregations that need to account for multiple orders by a single user.
Define the join for users to order_items
With this understanding of the explore syntax, you can now define a new Explore in the model file to join users to order_items.
- In the File Browser of the Looker IDE, click on the qwiklabs-looker model file to review and modify the code.
Notice that this model file is fairly empty. The only items are:
-
connection to specify the database connection name.
-
label to specify the display name for the group of Explores that are defined in this model.
-
include to specify that this model can leverage any view defined in the specified directory (in this case, the directory named views).
- On a new line after line 18 (last line of the comment), add the following starting code to create a new Explore named order_items:
explore: order_items { # View name 1 for the base view of the Explore.
label: "Ordered Items" # Display label for the Explore
join: users { # View name 2 that is being joined to view name 1.
type: REPLACE
sql_on: ${view_name_1.field_name} = ${view_name_2.field_name} ;; # Join based on user ID in each table.
relationship: REPLACE
}
}
Note: Be sure to keep the indentations that are included in each code block below to ensure the proper indentation in the new view file. Comments are included using # and can extend to new lines.
Consider what you have learned about how Looker leverages the relationship defined in joins for symmetric aggregations. Which values are most appropriate for type, sql_on, and relationship?
- Finalize the code for the new Explore by adding the values for
type, sql_on, and relationship.
Expand hint below to see the final values to finish the explore code
- Click Save Changes.
At this point, the join sql_on, type , and relationshipare set for the Explore to function properly. Together, these parameters inform Looker how to leverage the join to ensure that all queries adhere to the relationship between the two tables: many possible orders (each associated a user id) to a single user id.
Review the Explore that business users can use to query ordered item and related user data
Now that you have defined the Explore in the model file, you can preview it to see what your business users will experience when querying in the Explore.
-
On the Looker navigation menu (three horizontal lines), click Explore.
-
Under Cymbal Ecommerce, click Ordered Items.
-
Click the arrow next to Order Items.
-
Under Order Items > Dimensions, click User ID. Under Order Items > Measures, click Total Sale Price.
-
Click Run to see the results, and then click on the SQL tab to see the SQL query generated by Looker.
-
Click the arrow next to Users, and under Dimensions, click Email.
-
Click Run to see the results, and then click on the SQL tab to see the revised SQL query generated by Looker, which includes the join.
-
Under Order Items > Dimensions, click User ID again to deselect it.
-
Click Run to see the results, and then click on the SQL tab to see the revised SQL query generated by Looker, which still includes the join, but no longer includes the individual user IDs.
After testing, you have confirmed that this Explore is ready for business users, you can validate your LookML code in the model file and deploy the changes to this lab's production environment of Looker.
Commit changes and deploy to production
-
Click Validate LookML and then click Commit Changes & Push.
-
Add a commit message and click Commit.
-
Lastly, click Deploy to Production.
Click Check my progress to verify the objective.
Populate a model file with a new Explore
Task 4. Calculate a new measure using an existing measure
One of the key ways that Looker supports DRY code is by allowing you to use existing dimensions and measures to define new dimensions and measures. You may recall that in Task 2, you actually defined a new measure named total_sale_price using an existing dimension for sale_price. So you are already on your way to writing DRY code!
This also means that you can run simple calculations on existing measure or even break up complex calculations into multiple intermediate measures used in equations. This is another example of how easy Looker makes it to define objects once and reuse them as needed.
In this task, you apply a simple multiplication of 10% to the existing measure for total sale price to define a new measure for customer dividends, which are credits that are returned to customers based on a percentage of their total purchases.
-
Return the Looker IDE by clicking on the Looker navigation menu (icon with three horizontal lines), clicking Develop, and then clicking on the qwiklabs-looker project.
-
In the order_items view file, review the existing measure for total_sale_price.
Notice that the type is sum, and the sql identifies the existing dimension to be summed as sale_price, defined as $ followed by {sale_price}.
For calculations (such as 10% of an existing measure value), the type is set to number, and the multiplication can be added directly to the sql as 0.1 * ${measure_name}.
- In the order_items view file, add the starting code for the new measure, before the last closing curly bracket on line 109:
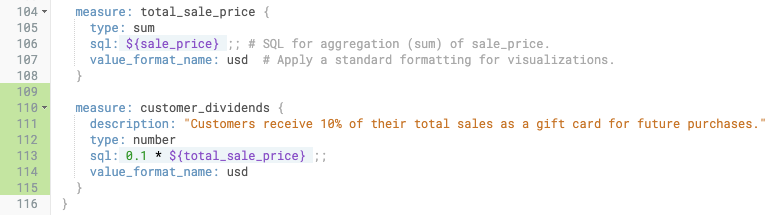
measure: customer_dividends {
description: "Customers receive 10% of their total sales as a gift card for future purchases."
type: number
sql: 0.1 * ${measure_name} ;;
value_format_name: usd
}
-
Update measure_name in the sql parameter to the correct reference name for the total purchases made by a customer (see quiz question above).
-
Click Save Changes.
The bottom of your view file for order_items should now resemble the following:
Review the generated SQL for queries in the Explore
-
On the Looker navigation menu (three horizontal lines), click Explore.
-
Under Cymbal Ecommerce, click Ordered Items.
-
Click the arrow next to Order Items.
-
Under Order Items > Dimensions, click User ID. Under Order Items > Measures, click Total Sale Price and Customer Dividends.
Note: You may need to refresh your browser to see the Customer Dividends measure.
- Click Run to see the results, and then click on the SQL tab to see the SQL query generated by Looker.
Commit changes and deploy to production
-
Click Validate LookML and then click Commit Changes & Push.
-
Add a commit message and click Commit.
-
Lastly, click Deploy to Production.
Click Check my progress to verify the objective.
Calculate a new measure using an existing measure
Task 5. Create a native derived table
Another great feature of Looker is the ability to create derived tables that function similarly to a defined view in a standard database. These derived tables are queries whose results can be used as if the results were actual tables in the database. Looker supports two types of derived tables: SQL-based (for which you define a SQL query directly in the LookML) and native derived tables (which are defined by pointing to existing LookML objects).
Regarding DRY code, this means that you can define a native derived table using existing views, dimensions, and measures. As you recall, if an underlying table or column name needs to be updated, then you only have to update it once in the original definition of the object, and then all other objects referencing that object are automatically updated to use the new definition. Update once, and you're done!
In this task, you create a native derived table using the existing Explore you already created for Ordered Items, so that your business users can easily query contact information for the top 100 customers for additional marketing efforts.
Define a new native derived table from an Explore query
-
On the Looker navigation menu, click Explore.
-
Under Cymbal Ecommerce, click Ordered Items.
-
Click the arrow next to Order Items.
-
Under Order Items > Dimensions, click User ID.
-
Under Order Items > Measures, click Total Sale Price and Customer_Dividends.
-
Under Users > Dimensions, click Email.
-
On the menu for the Results pane, update the Row Limit to 100 to select the top 100 users based on the highest total sales.
-
Click Run to see the results, and click on the SQL tab to review the generated query.
SELECT
order_items.user_id AS order_items_user_id,
users.email AS users_email,
0.1 * COALESCE(SUM(order_items.sale_price ), 0) AS order_items_customer_dividends,
COALESCE(SUM(order_items.sale_price ), 0) AS order_items_total_sale_price
FROM `cloud-training-demos.thelook_ecommerce.order_items`
AS order_items
LEFT JOIN `cloud-training-demos.thelook_ecommerce.users` AS users ON order_items.user_id = users.id
GROUP BY
1,
2
ORDER BY
3 DESC
LIMIT 100
In theory, you could use this SQL query to define a SQL-based derived table, but if there are any future changes to the table or column names, then you would have to ensure that all of those references are updated in the query for the derived table, too.
With a native derived table, only the original definitions for the view, dimensions, and measures would need to be updated, and the native derived table would automatically reference the new table and column names. Plus, in the next steps, you see how easy it is to define native derived tables!
-
Click Settings ( ) next to Run (top right of page), and select Get LookML.
-
Click on the tab for Derived Table, and copy the LookML code to your computer clipboard. Close the Get LookML window.
In the next section, you add this LookML code into a new view file for this native derived table.
Create a new view file for the native derived table
-
Return the Looker IDE by clicking on the Looker navigation menu (icon with three horizontal lines), clicking Develop, and then clicking on the qwiklabs-looker project.
-
In the File Browser, next to the views folder, click Folder Options (three vertical dots), and select Create View.
To see the Folder Options, hover your cursor over the folder name views in the File Browser.
-
For file name, type: top_100_users, and click Create.
-
Delete all of the auto-generated LookML in the view file, and paste the LookML code you copied for the native derived table:
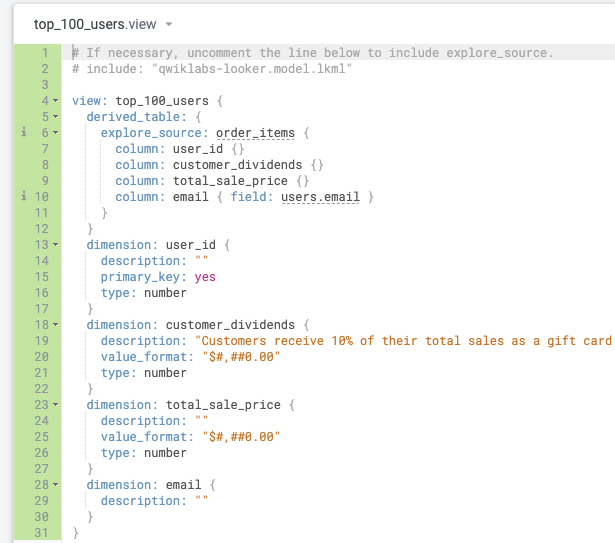
# If necessary, uncomment the line below to include explore_source.
# include: "qwiklabs-looker.model.lkml"
view: add_a_unique_name_1754339044 {
derived_table: {
explore_source: order_items {
column: user_id {}
column: customer_dividends {}
column: total_sale_price {}
column: email { field: users.email }
}
}
dimension: user_id {
description: ""
type: number
}
dimension: customer_dividends {
description: "Customers receive 10% of their total sales as a gift card for future purchases."
value_format: "$#,##0.00"
type: number
}
dimension: total_sale_price {
description: ""
value_format: "$#,##0.00"
type: number
}
dimension: email {
description: ""
}
}
Notice that Looker makes a suggestion to include the model file in line 2 but the lines are commented out. It is best practice to leave the line for the model file commented out. The reason is that model files almost always include other files, so if you have lots of files including each other, then you risk creating circular dependencies in your model. This can cause syntax validation errors.
Looker also makes the suggestion to add a description to each dimension, so you can easily add more information about each one. Feel free to add descriptions!
- Replace the auto-generated view name (such as add_a_unique_name_1623275538) with: top_100_users.
Recall that accurately defined primary keys are also important for symmetric aggregation and joins, so it is best practice to define the primary key when you first create the view, even if you do not plan to join it to another view.
- In the dimension: user_id definition, add a new line before
type: number, and type: primary_key: yes on line 15.
Your new view file should resemble the following:
- Click Save Changes.
At this point, you can add more dimensions such as first_name and last_name or join the native derived table to your existing Explore by referring to the previous tasks (particularly Tasks 2 and 3).
For now, the new view called top_100_users is ready for you to finish out the Git workflow below, so that you can execute the progress check below.
You successfully made it to the end, and created multiple Looker objects that you can finalize for your business users to query information about the top 100 customers.
Commit changes and deploy to production
-
Click Validate LookML and then click Commit Changes & Push.
-
Add a commit message and click Commit.
-
Lastly, click Deploy to Production.
Click Check my progress to verify the objective.
Create a native derived table
Want more practice with defining Explores?
Repeat the steps in Task 3 to join the new native derived table files for top_100_users to the existing Explore that you created for business users. Or apply your skills to create a new Explore by modifying example in Task 3 to create a simple Explore without a join!
Congratulations!
In this lab, you learned how to use SQL Runner to review database tables in Looker, create new view files to represent database tables using LookML, and define Explores in a LookML model file to enable business user to query these tables without needing to write their own SQL queries. You also learned how to define new dimensions and measures using existing dimensions and measures and how to create native derived tables to leverage DRY principles in LookML.
Next steps / Learn more
Google Cloud training and certification
...helps you make the most of Google Cloud technologies. Our classes include technical skills and best practices to help you get up to speed quickly and continue your learning journey. We offer fundamental to advanced level training, with on-demand, live, and virtual options to suit your busy schedule. Certifications help you validate and prove your skill and expertise in Google Cloud technologies.
Manual Last Updated August 4, 2025
Lab Last Tested August 4, 2025
Copyright 2026 Google LLC. All rights reserved. Google and the Google logo are trademarks of Google LLC. All other company and product names may be trademarks of the respective companies with which they are associated.


